
Bitcoin Price Flashes Biggest Warning of 2026: Is a Drop to $56,000 Coming?

- Bitcoin’s rebound hides a structural weakness forming just below current price
- A major supply zone now sits at the center of Bitcoin’s next move
- Rising leverage and weak institutional support create a weak recovery case
Bitcoin price has rebounded more than 4% since February 19, helping it recover above $68,200. This bounce offered temporary relief after weeks of weakness. However, new technical and on-chain signals now show that Bitcoin may be approaching its most dangerous level of 2026.
A combination of bearish chart structure, heavy supply clusters below price, and rising leverage risk suggests a deeper correction could begin soon.
Bearish Pattern and Largest Supply Cluster Create Immediate Risk
Bitcoin’s 8-hour chart currently shows a head-and-shoulders pattern. This is a bearish reversal structure that forms when price creates three peaks, with the middle peak higher than the others. It signals weakening buying strength and increasing selling pressure.
At the same time, Bitcoin has formed a hidden bearish divergence between February 6 and February 20. During this period, the Bitcoin price created a lower high, meaning the recovery failed to fully regain its previous peak.
However, the Relative Strength Index, or RSI, formed a higher high.
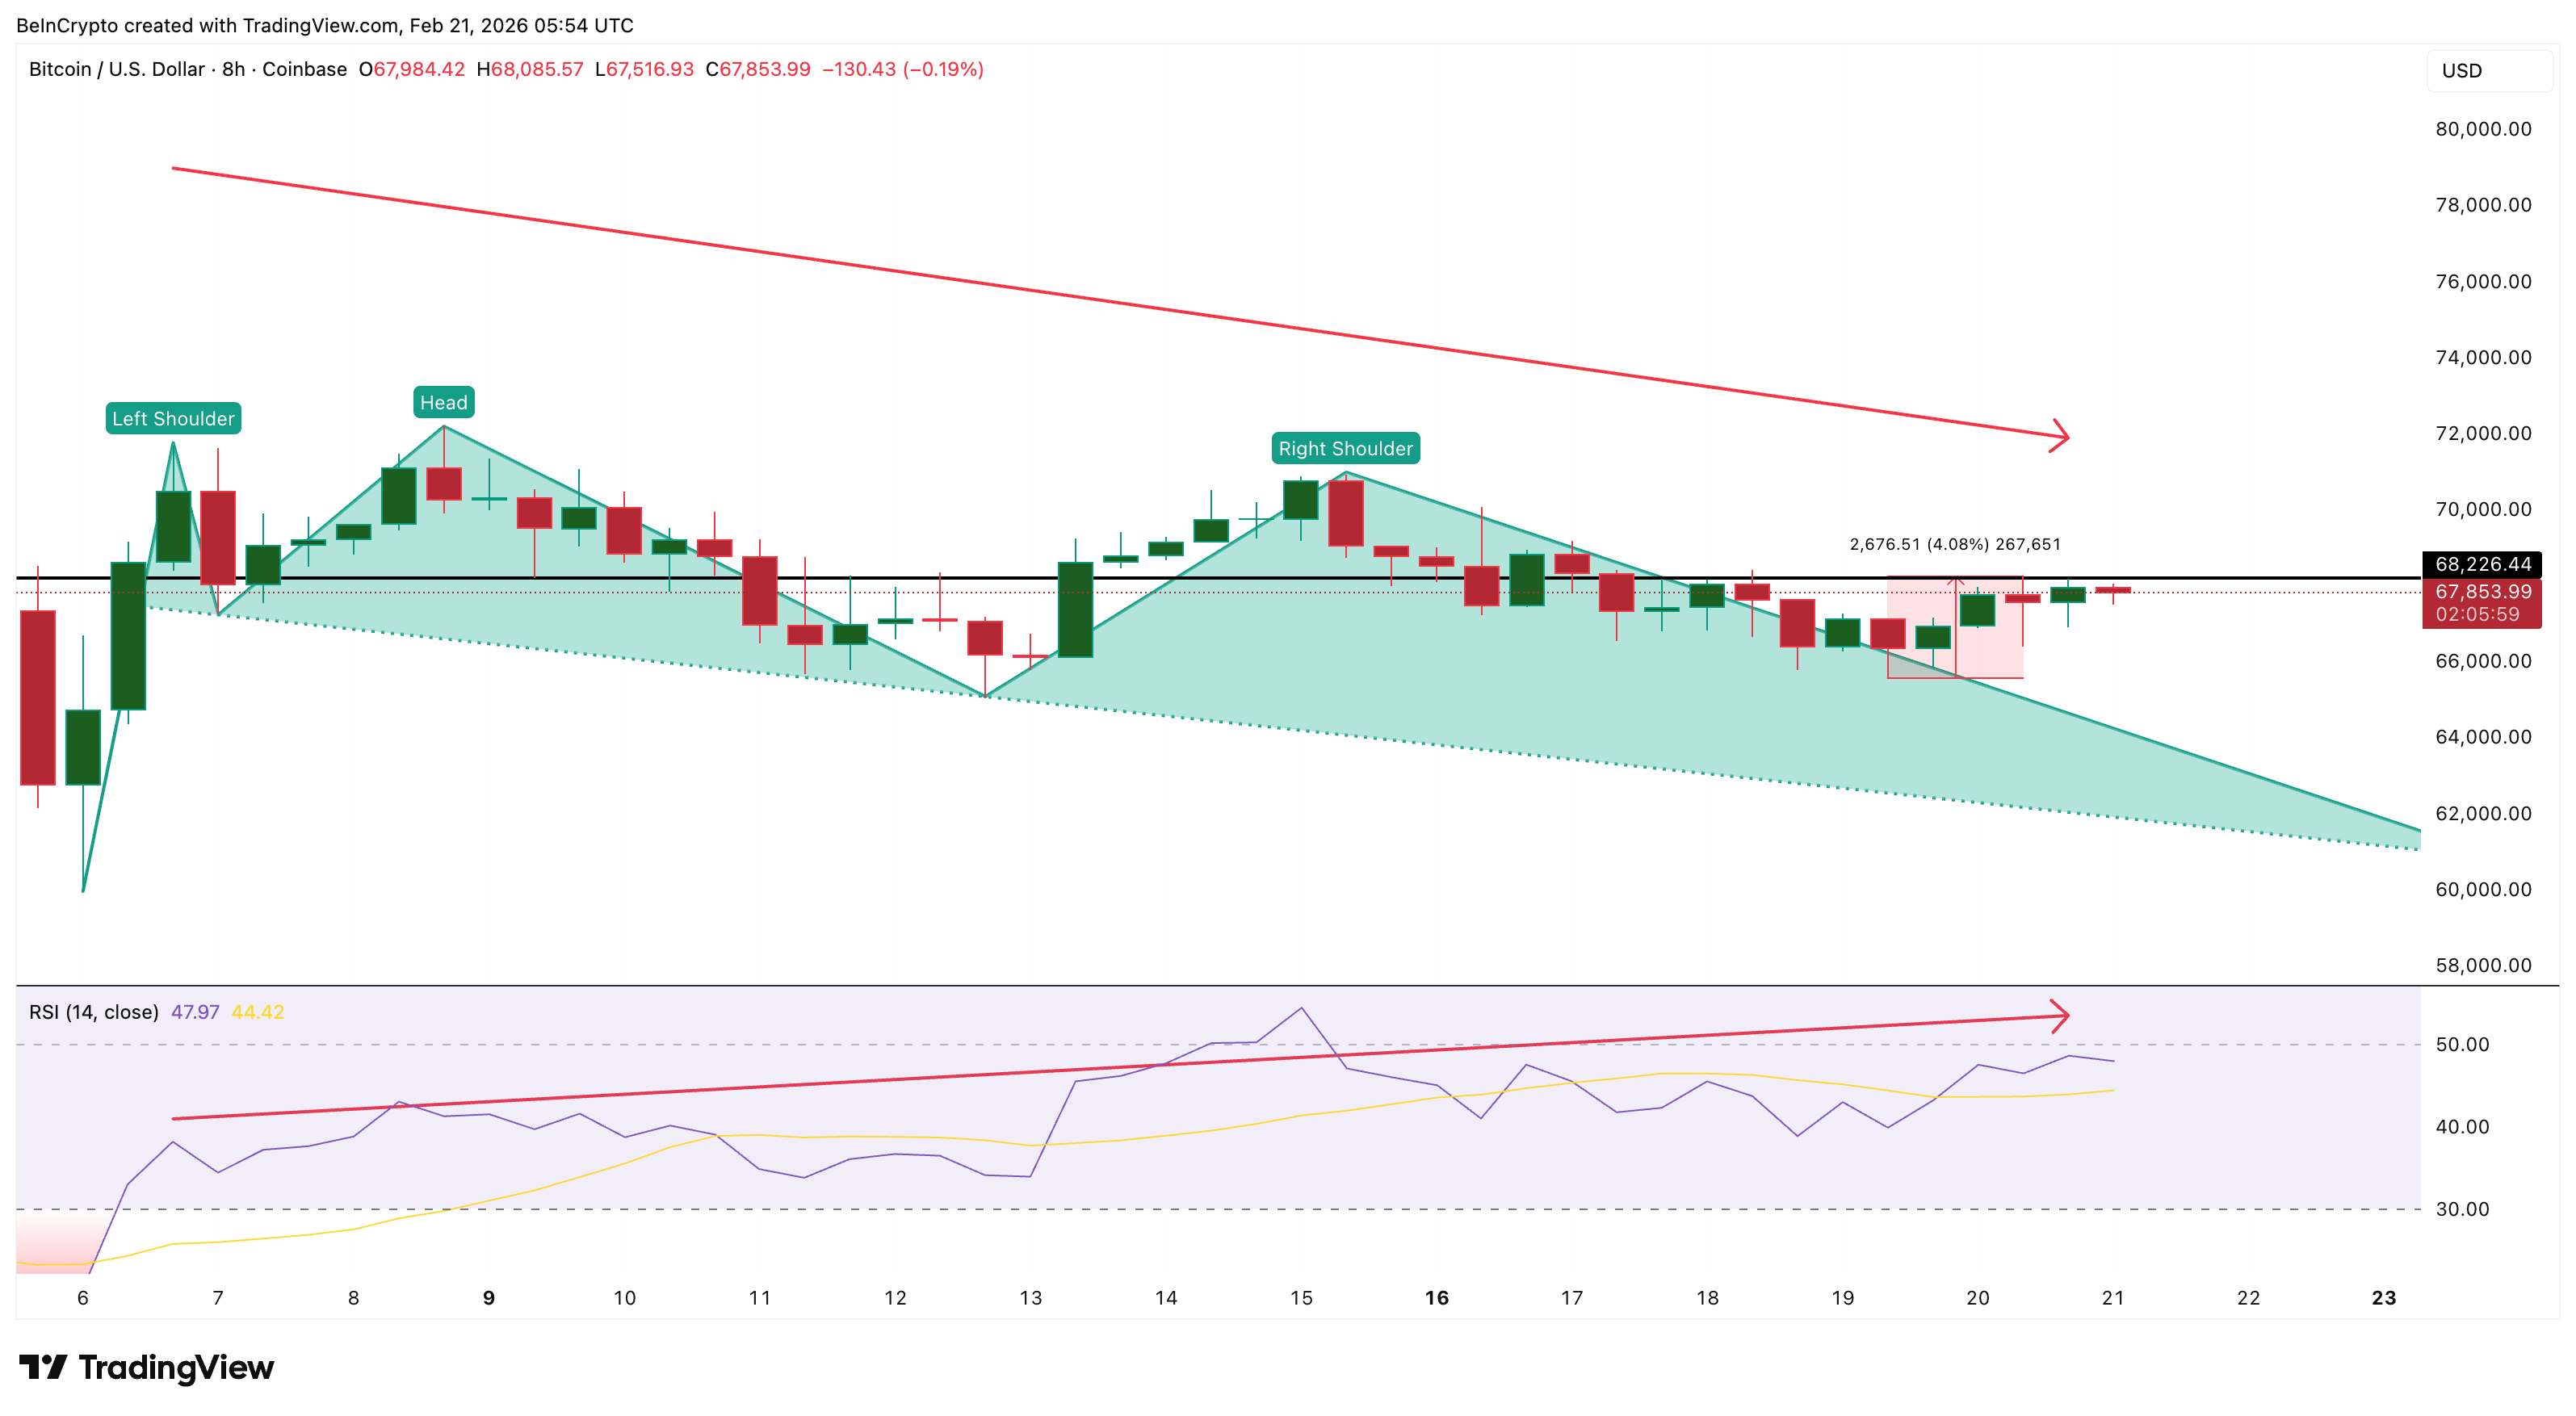
RSI measures buying and selling momentum on a scale from 0 to 100. When RSI rises, but price fails to rise equally, it shows that buying strength is weakening. This pattern often appears before price declines or pullbacks.
The biggest risk now comes from Bitcoin’s on-chain cost basis levels. Data from the UTXO Realized Price Distribution, or URPD, shows that the largest supply cluster sits at above $66,800. This level holds 3.17% of Bitcoin’s total circulating supply.
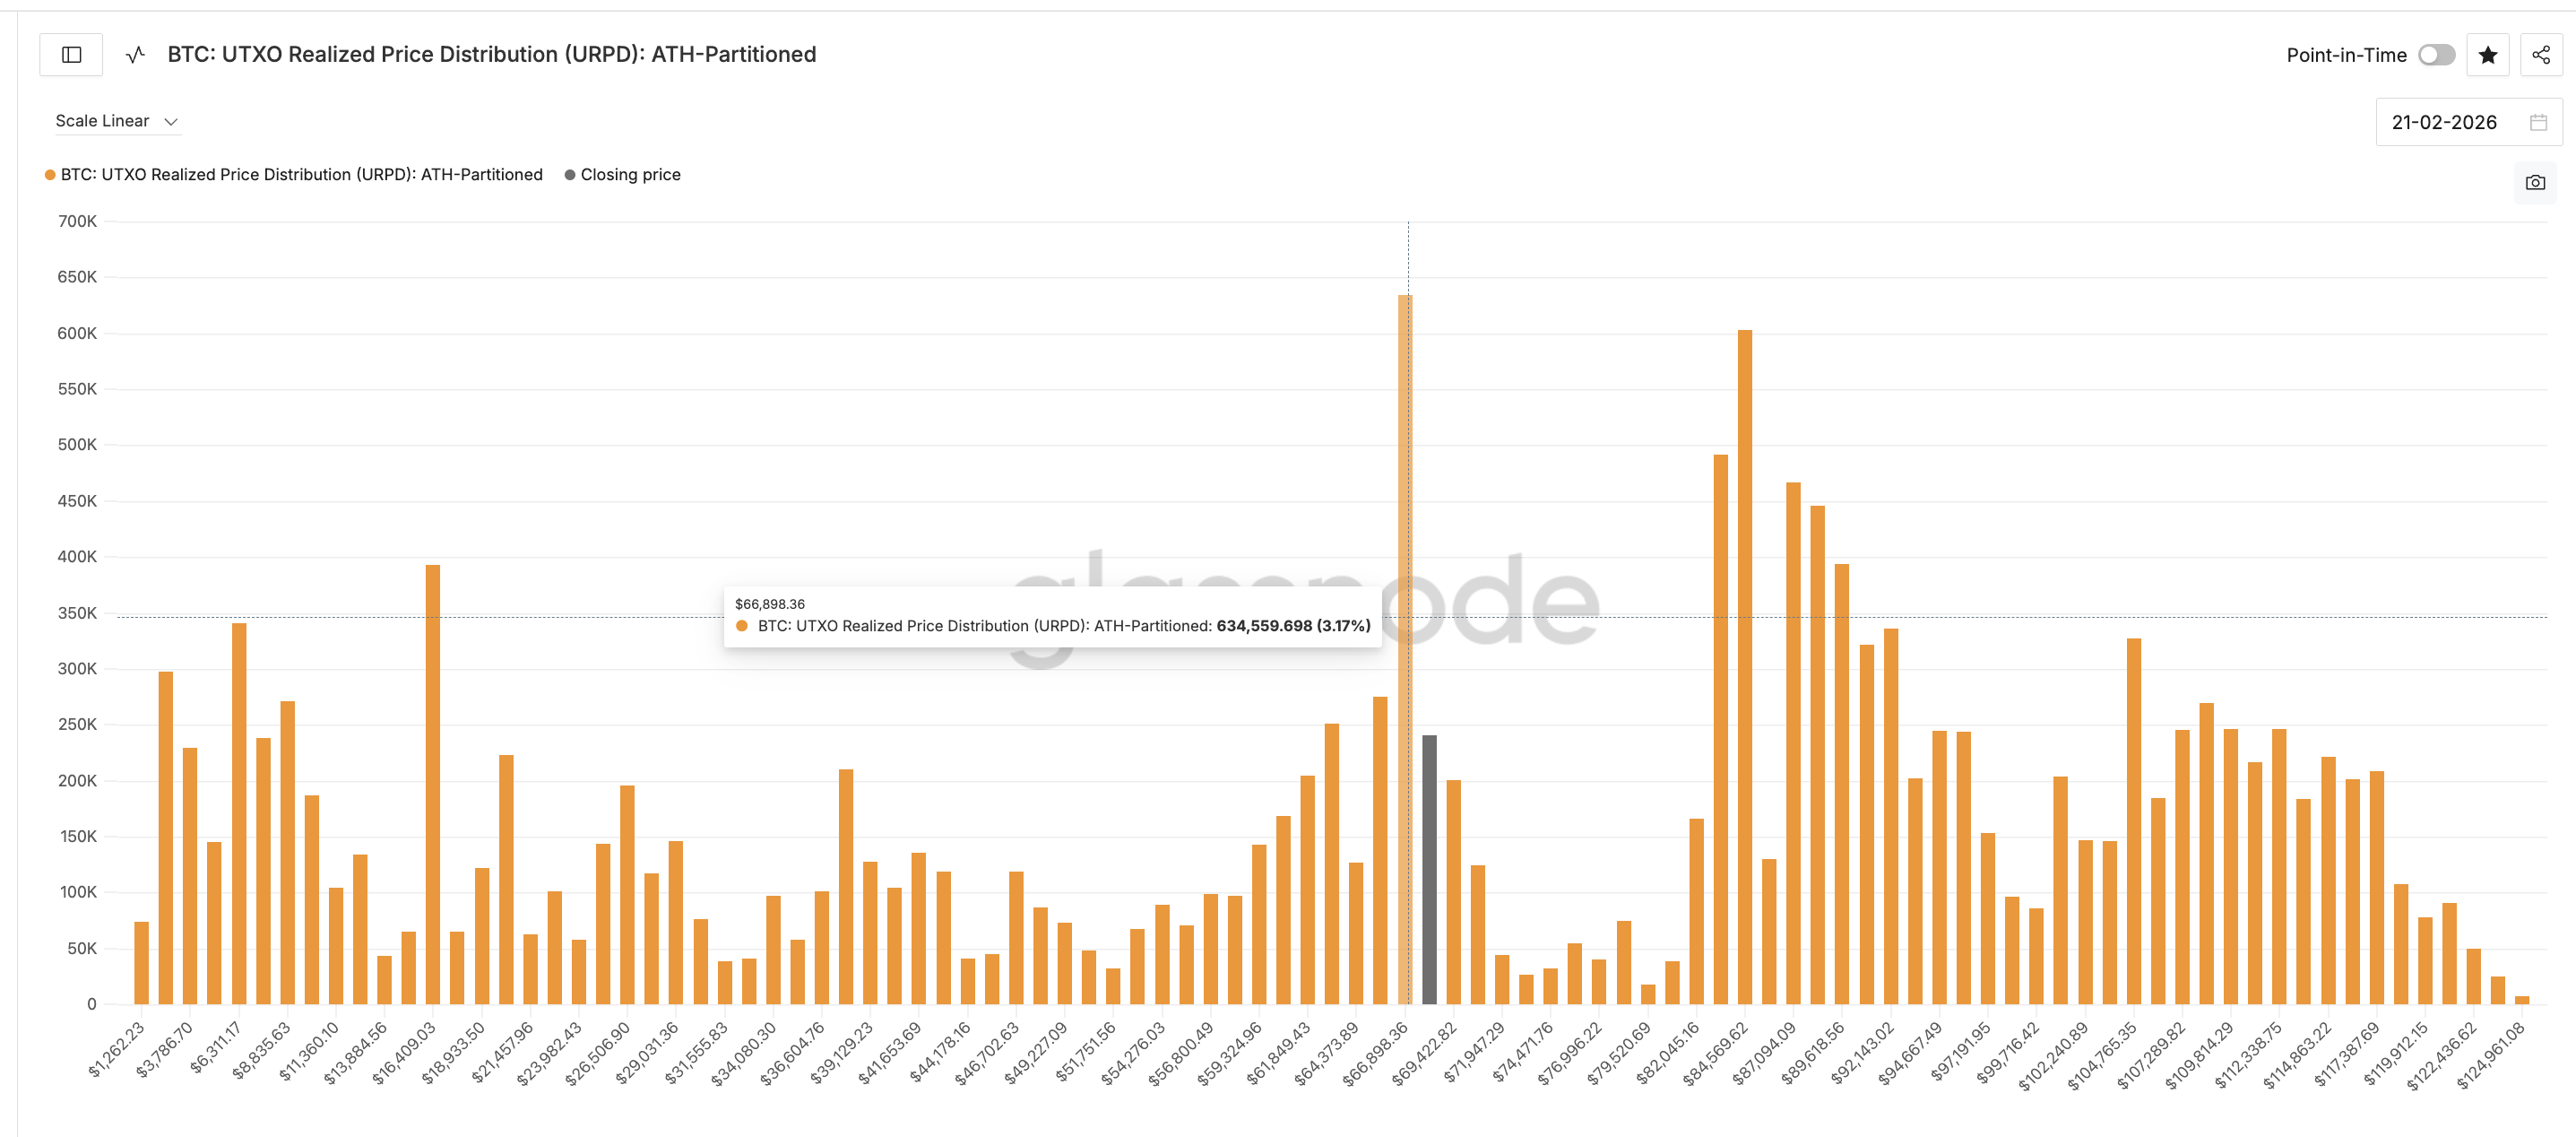
Another major cluster sits at $65,636, holding an additional 1.38% of supply.
These levels are important because they represent prices at which many investors bought Bitcoin. If Bitcoin falls below these levels, holders may begin selling to avoid losses. This can accelerate the price decline quickly.
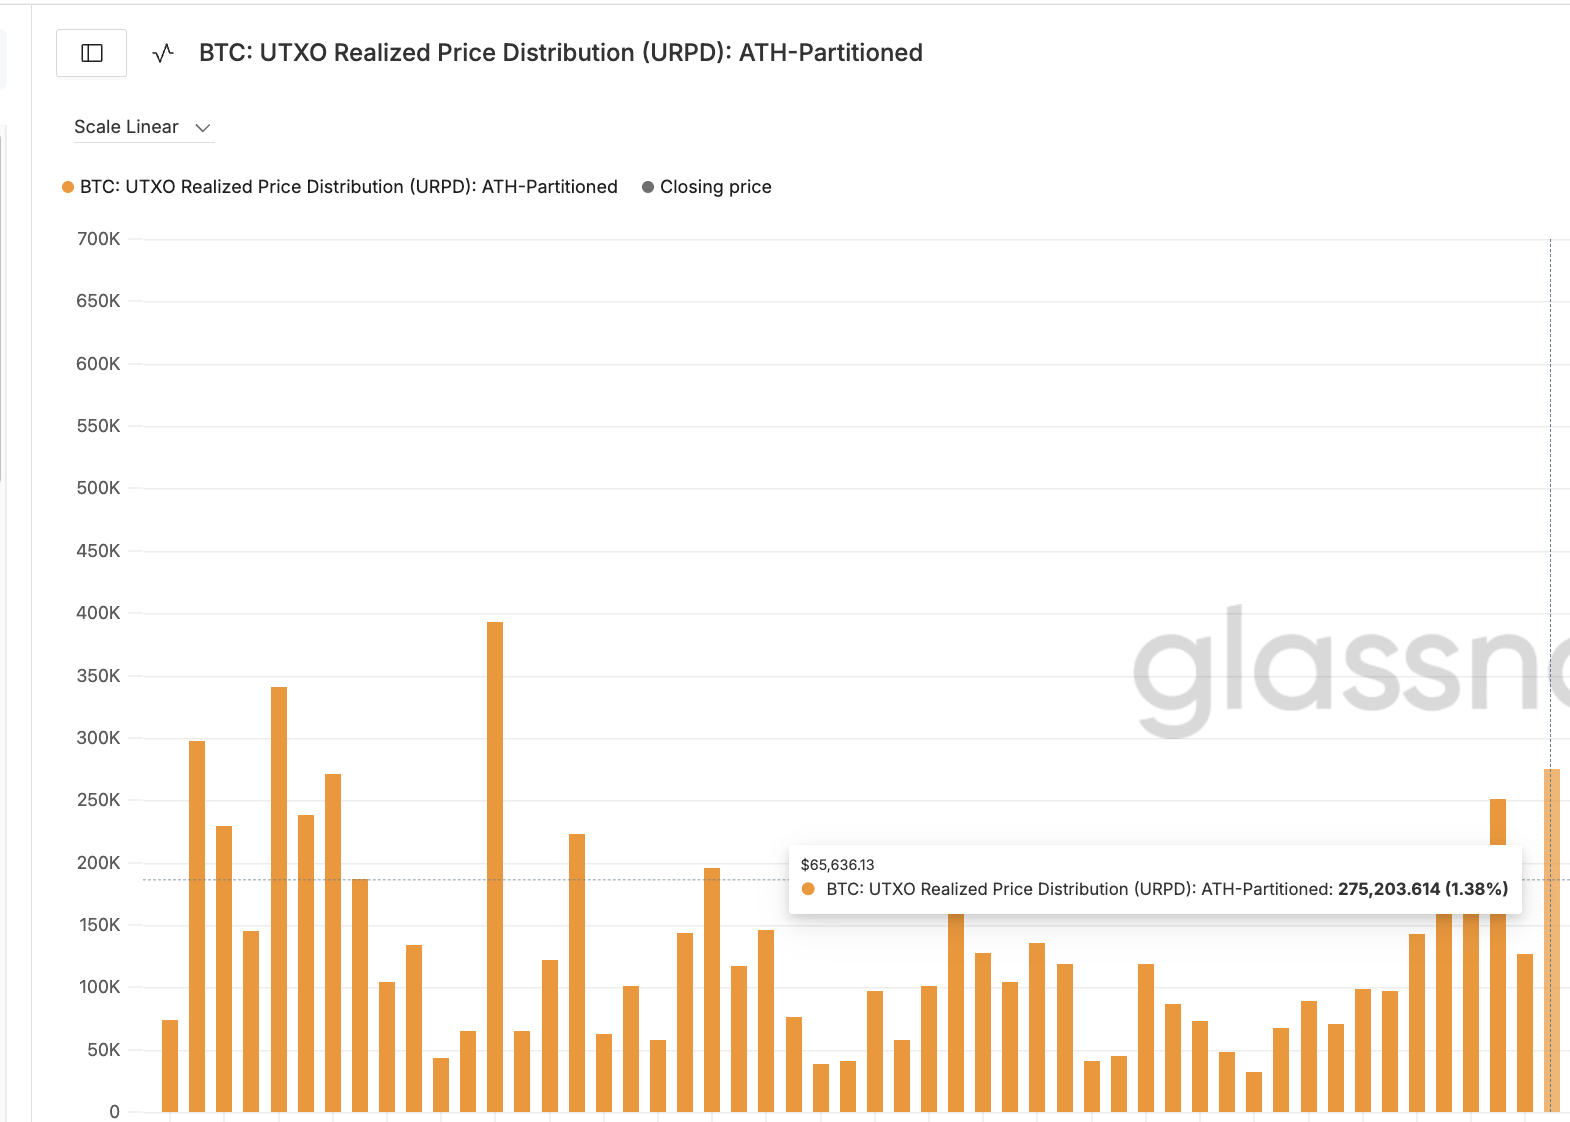
Together, these clusters represent more than 4.5% of Bitcoin’s supply concentrated just below the current price. This creates a high-risk zone directly under Bitcoin’s support. That explains the biggest price warning
If Bitcoin closes below this region, the head-and-shoulders pattern realization could gain strength.
Get to know Godleak
Godleak crypto signal is a service which provide profitable crypto and forex signals for trading. Godleak tried to provide you signals of best crypto vip channels in the world.
It means that you don’t need to buy individual crypto signal vip channels that have expensive prices. We bought all for you and provide you the signals with bot on telegram without even a second of delay.

Godleak crypto leak service have multiple advantages in comparision with other services:
- Providing signal of +160 best crypto vip channels in the world
- Using high tech bot to forward signals
- Without even a second of delay
- Joining in +160 separated channels on telegram
- 1 month, 3 months , 6 months and yearly plans
- Also we have trial to test our services before you pay for anything
For joining Godleak and get more information about us only need to follow godleak bot on telegram and can have access to our free vip channels. click on link bellow and press start button to see all features
Join for Free
☟☟☟☟☟
https://t.me/Godleakbot
Also you can check the list of available vip signal channels in the bot. by pressing Channels button.
  &
Rising Leverage and ETF Outflows Increase Liquidation Threat
Derivatives data shows rising liquidation risk as Bitcoin rebounded. Open interest, which measures the total value of active futures positions, has increased from $19.54 billion on February 19 to about $20.71 billion now, during the bounce.
This means more traders have entered leveraged positions during the recovery.
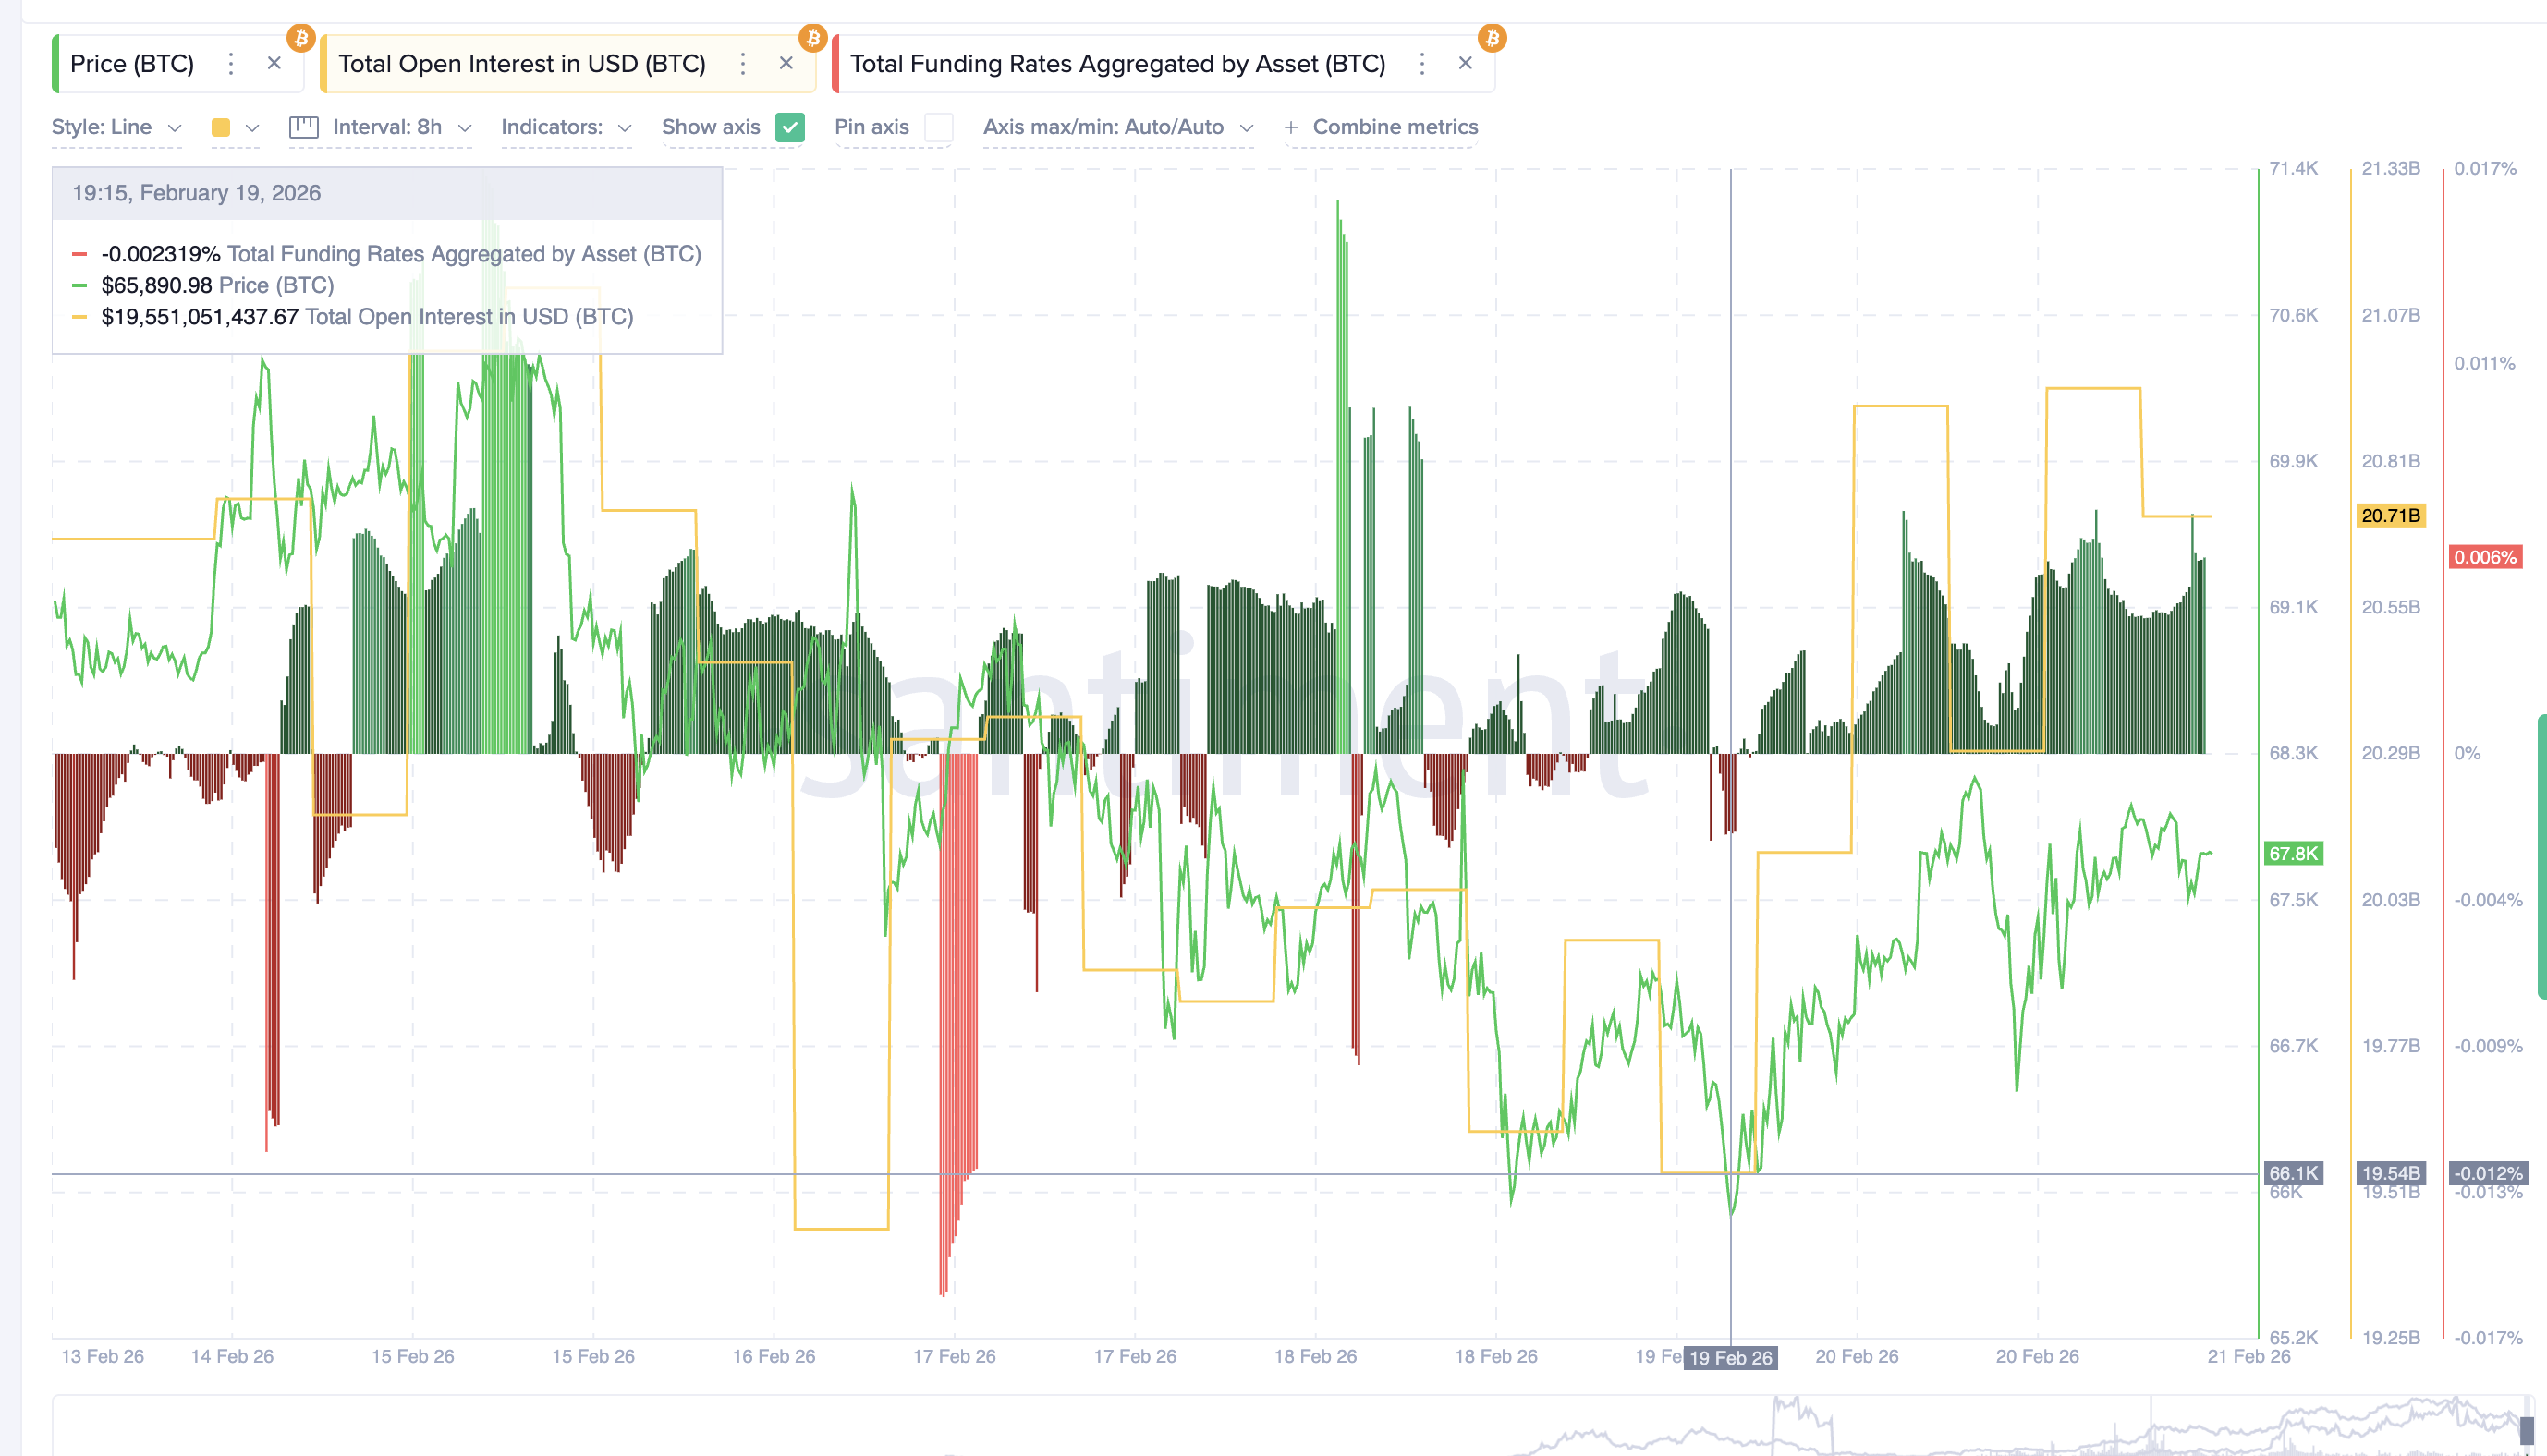
At the same time, funding rates have turned positive. Funding rates are payments between long and short traders. Positive funding means more traders are betting on price increases. This creates a dangerous situation.
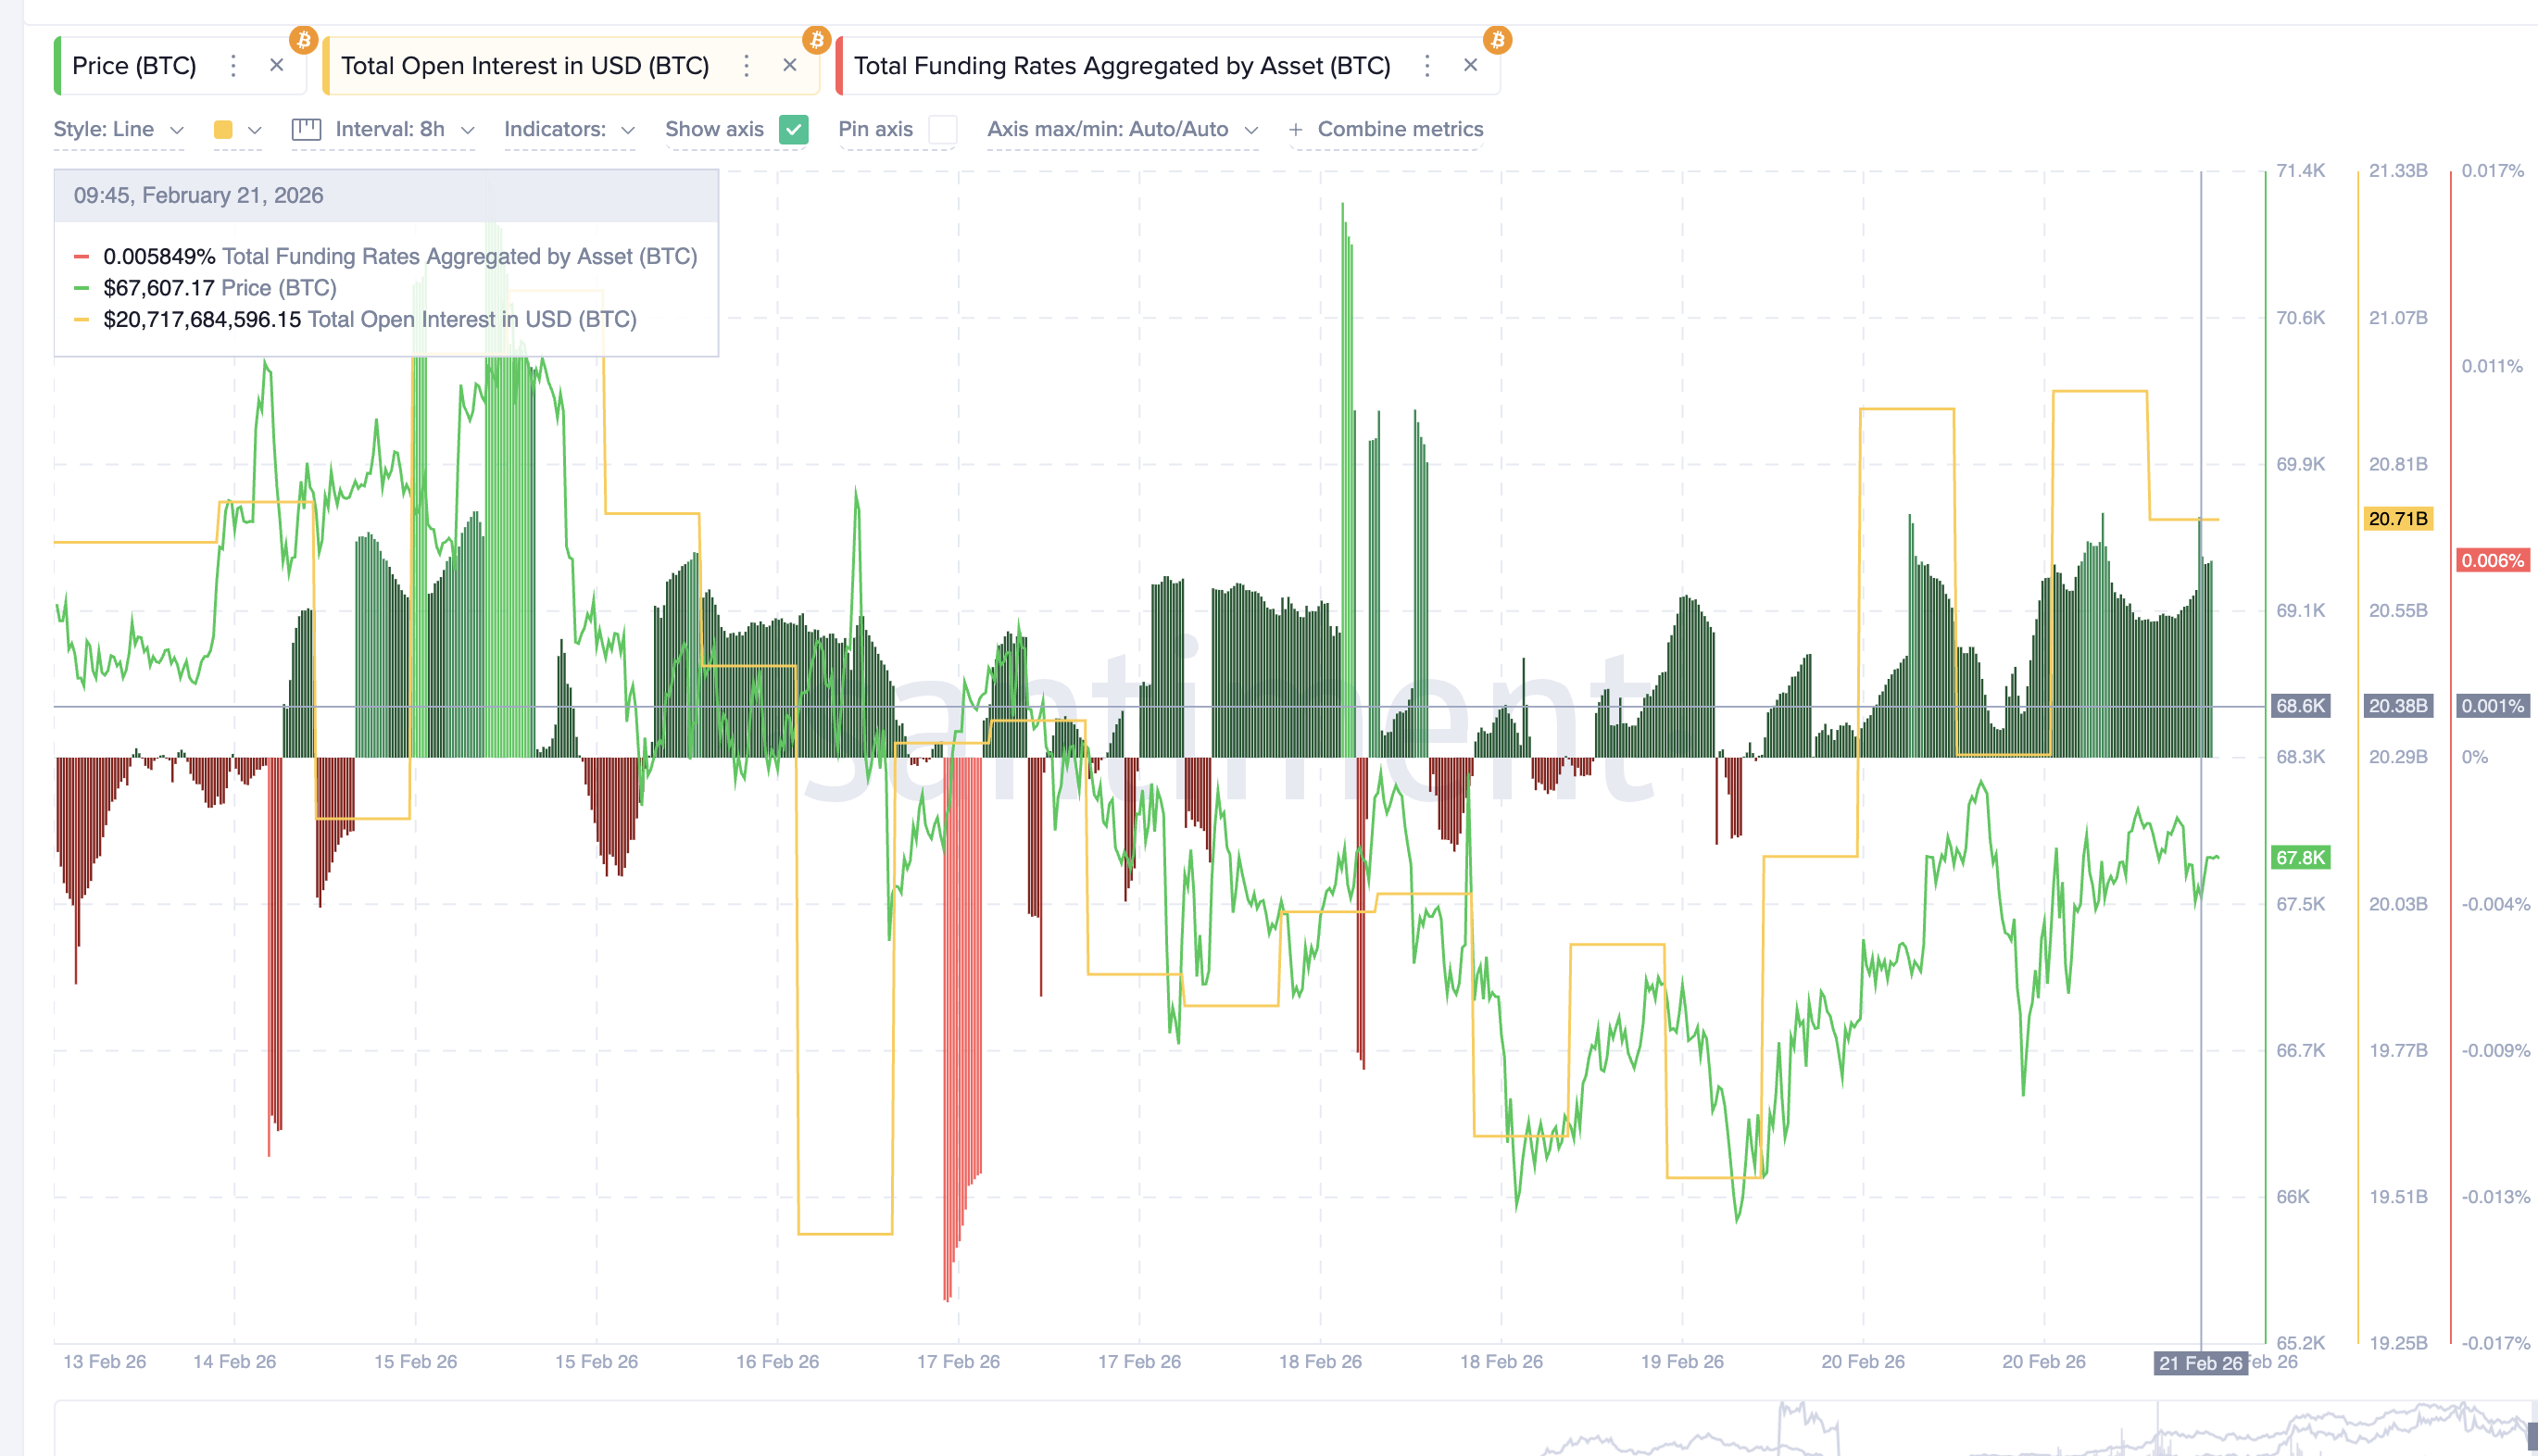
If the Bitcoin price starts falling, these leveraged long positions may be forced to close. This triggers a long squeeze, where bullish traders are pushed out of their positions. Such forced exits can create a liquidation cascade, adding extra selling pressure and accelerating the price drop.
Institutional sentiment also remains weak. Spot Bitcoin ETFs have now recorded five consecutive weeks of net outflows. This shows that institutional investors are still withdrawing capital rather than accumulating.
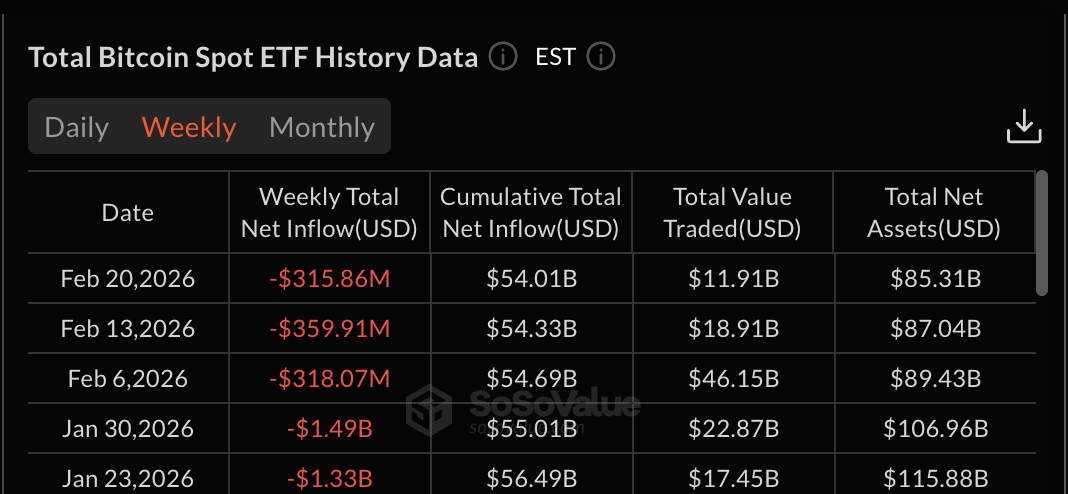
This reduces support during price declines.
Bitcoin Price Faces Critical Test Below Institutional Resistance
Bitcoin also remains below its monthly Volume Weighted Average Price, or VWAP, which sits near $70,000. VWAP represents the average price weighted by trading volume. Monthly VWAP is widely used as a proxy for institutional cost basis.
When Bitcoin trades below VWAP, it means the average institutional position is currently at a loss. This often causes institutions to reduce exposure or avoid new buying, explaining the ETF apathy.
A recovery above $70,000 would signal renewed institutional strength. But as long as Bitcoin stays below this level, recovery attempts may remain limited, and the broader structure remains bearish.
On the downside, Bitcoin’s first key support sits near $67,300. If this level breaks, the next support appears at $66,500, followed by $65,300. These levels align closely with the major supply clusters mentioned earlier. Failure to hold these levels could trigger the larger head-and-shoulders breakdown near the $60,800 neckline.
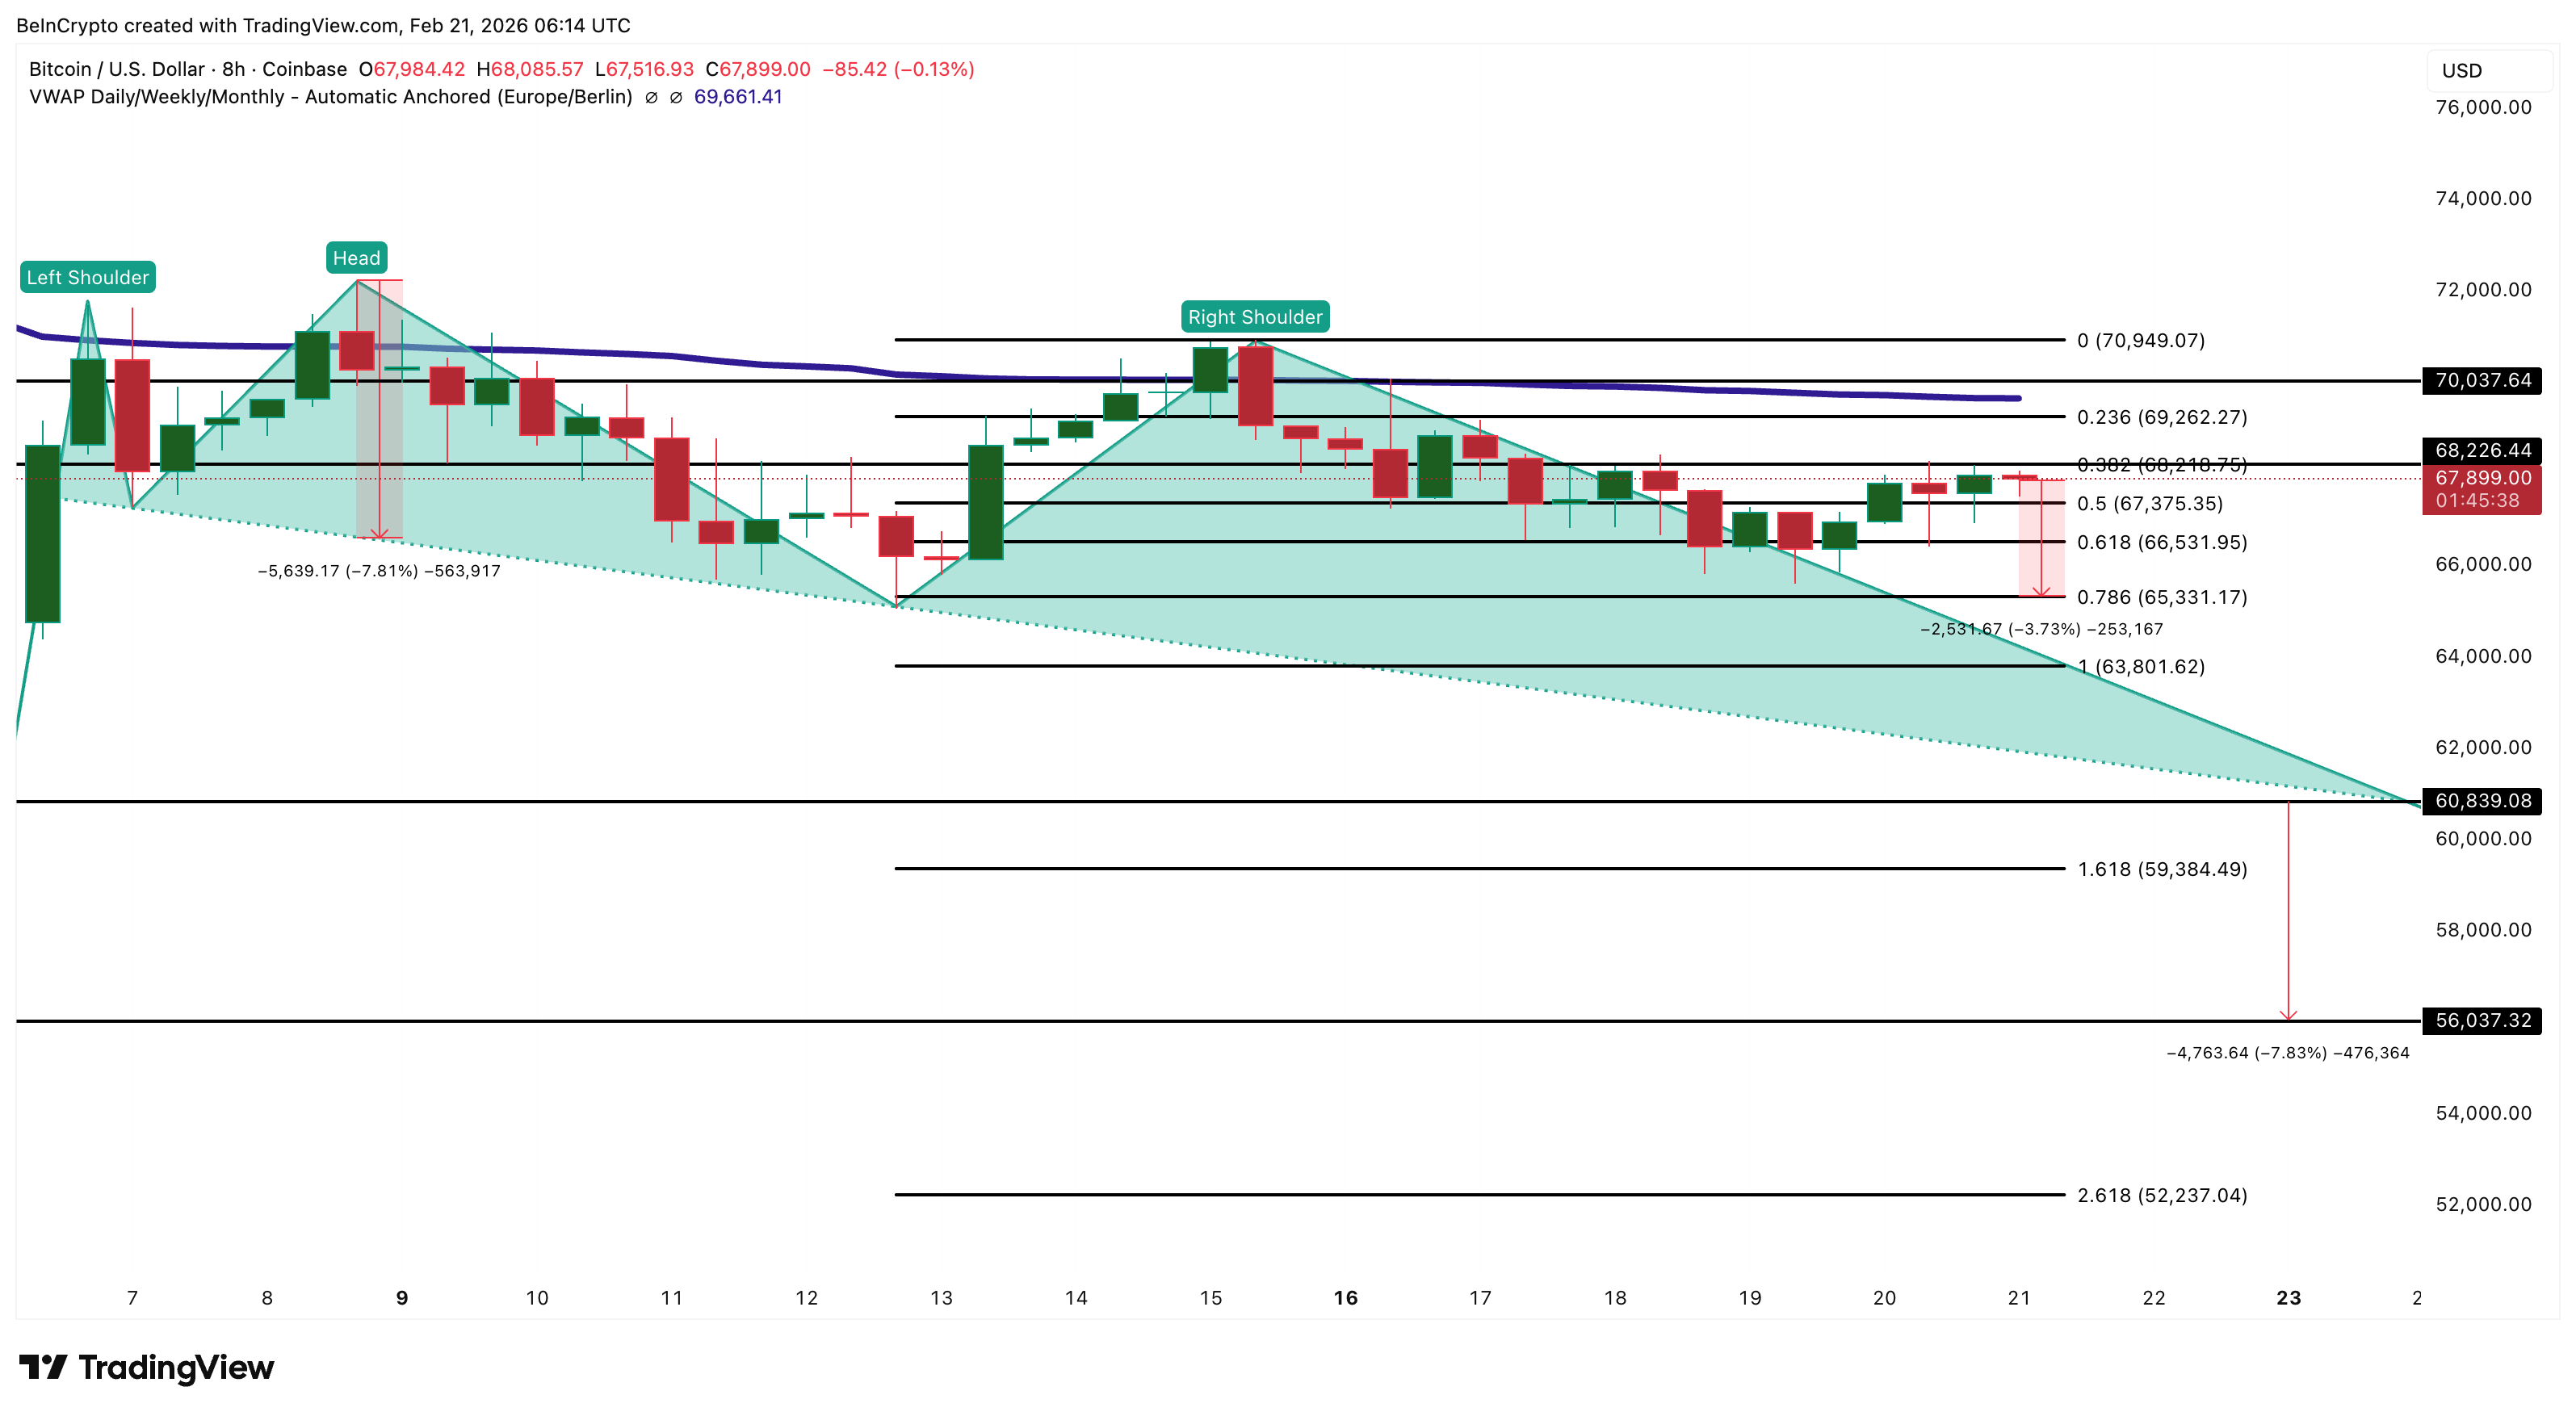
A breakdown can then trigger a price breakdown target of over 7.5%, hinting at a target price of $56,000, in the near-to-mid-term.
On the upside, Bitcoin must reclaim $68,200 to stabilize its short-term structure. However, a full recovery would require reclaiming the $70,000 VWAP level.


