
Binance Coin (BNB) Eyes Breakout as Bullish Signals Strengthen

In Brief
- BNB trades in an ascending triangle since August 6, rebounding 16% from a $463.97 low.
- Break above $524 resistance could trigger a rally to $561; failure may lead to a drop toward $476.
- Technical indicators like Parabolic SAR and MACD confirm bullish momentum as buyers push for a breakout.
Binance Coin (BNB) has been trading within an ascending triangle pattern since August 6, following a sharp drop to a five-month low of $463.97 during the market decline on August 5.
Currently priced at $522.63, BNB has experienced a 16% price increase since that dip.
Binance Coin Attempts to Break Resistance
An ascending triangle pattern forms when an asset’s price moves within a range defined by a flat horizontal resistance line above and a rising support line below. This pattern signals bullish momentum, suggesting that buyers are gaining strength and pushing the price higher, while sellers maintain steady resistance.
Since BNB started trading within this pattern, it has encountered resistance at $524, a level it now aims to break. If BNB breaks above this resistance, it would indicate that buying pressure has surpassed selling activity, potentially leading to a continued uptrend.
Supporting this outlook are readings from BNB’s technical indicators. The Parabolic Stop and Reverse (SAR) indicator, for instance, shows a strong bullish bias, as the dots currently lie below BNB’s price.
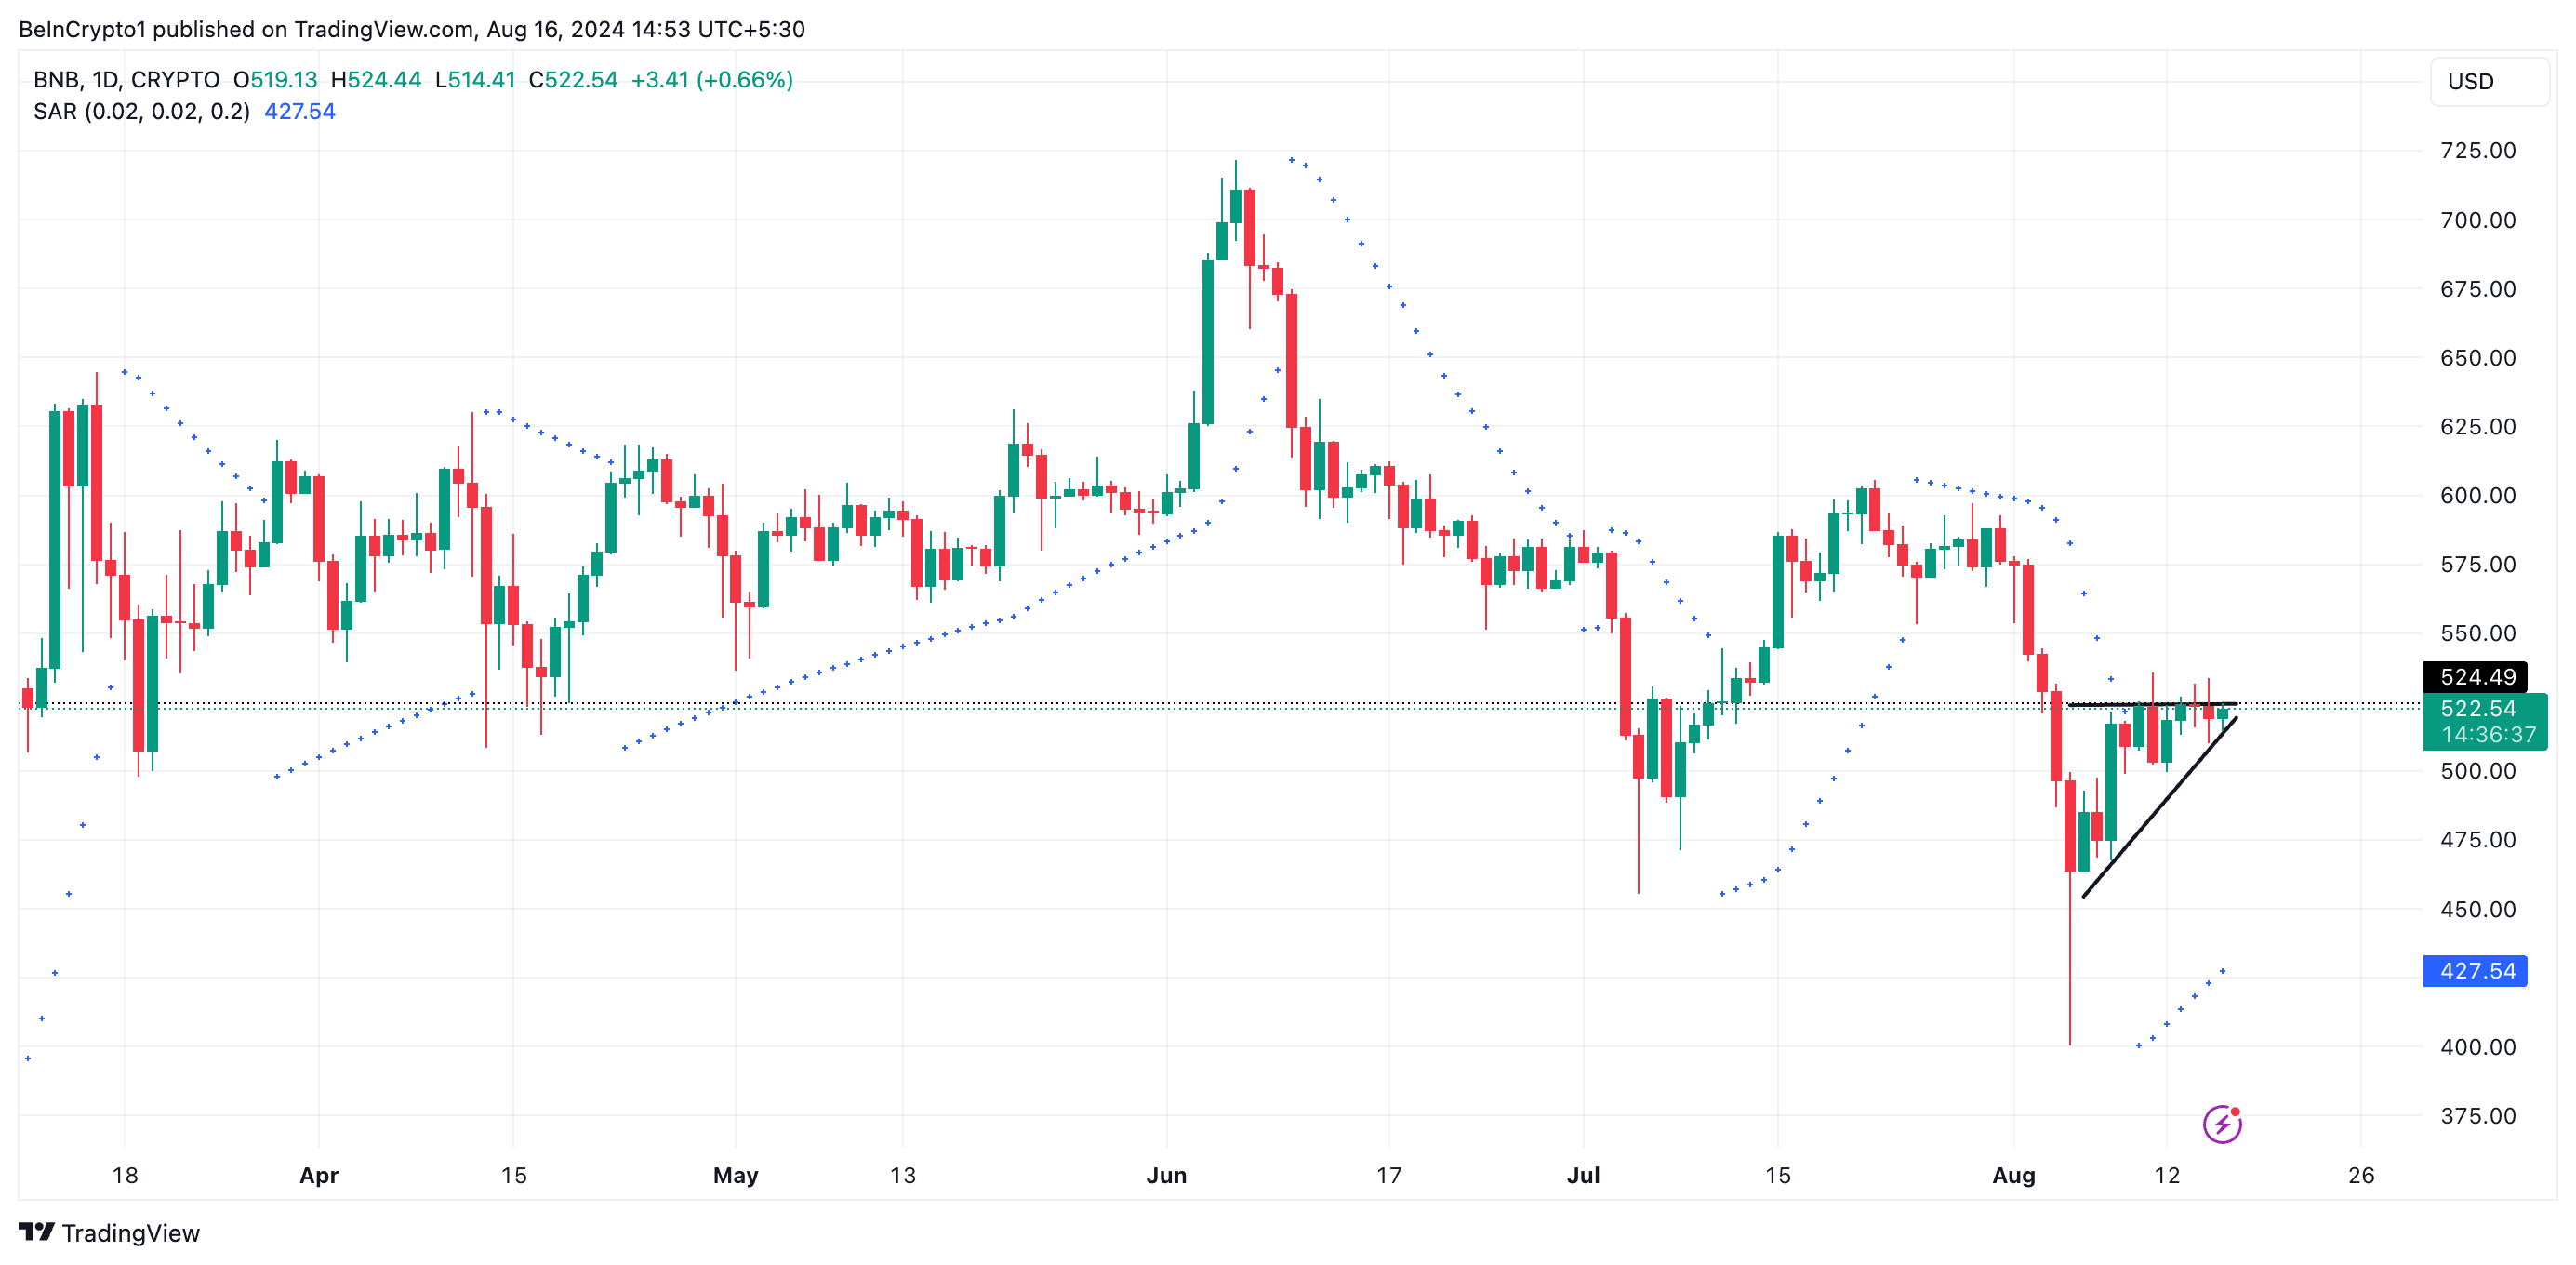
The Parabolic SAR indicator tracks an asset’s price direction and identifies possible reversal points. When its dots appear below the asset’s price, it indicates an uptrend, suggesting that the asset’s price has been rising and that the growth could continue.
Additionally, BNB’s Moving Average Convergence Divergence (MACD) indicator reflects stronger buying pressure than selling activity. Currently, the MACD line (blue) is positioned above the signal line (orange), further confirming bullish momentum.
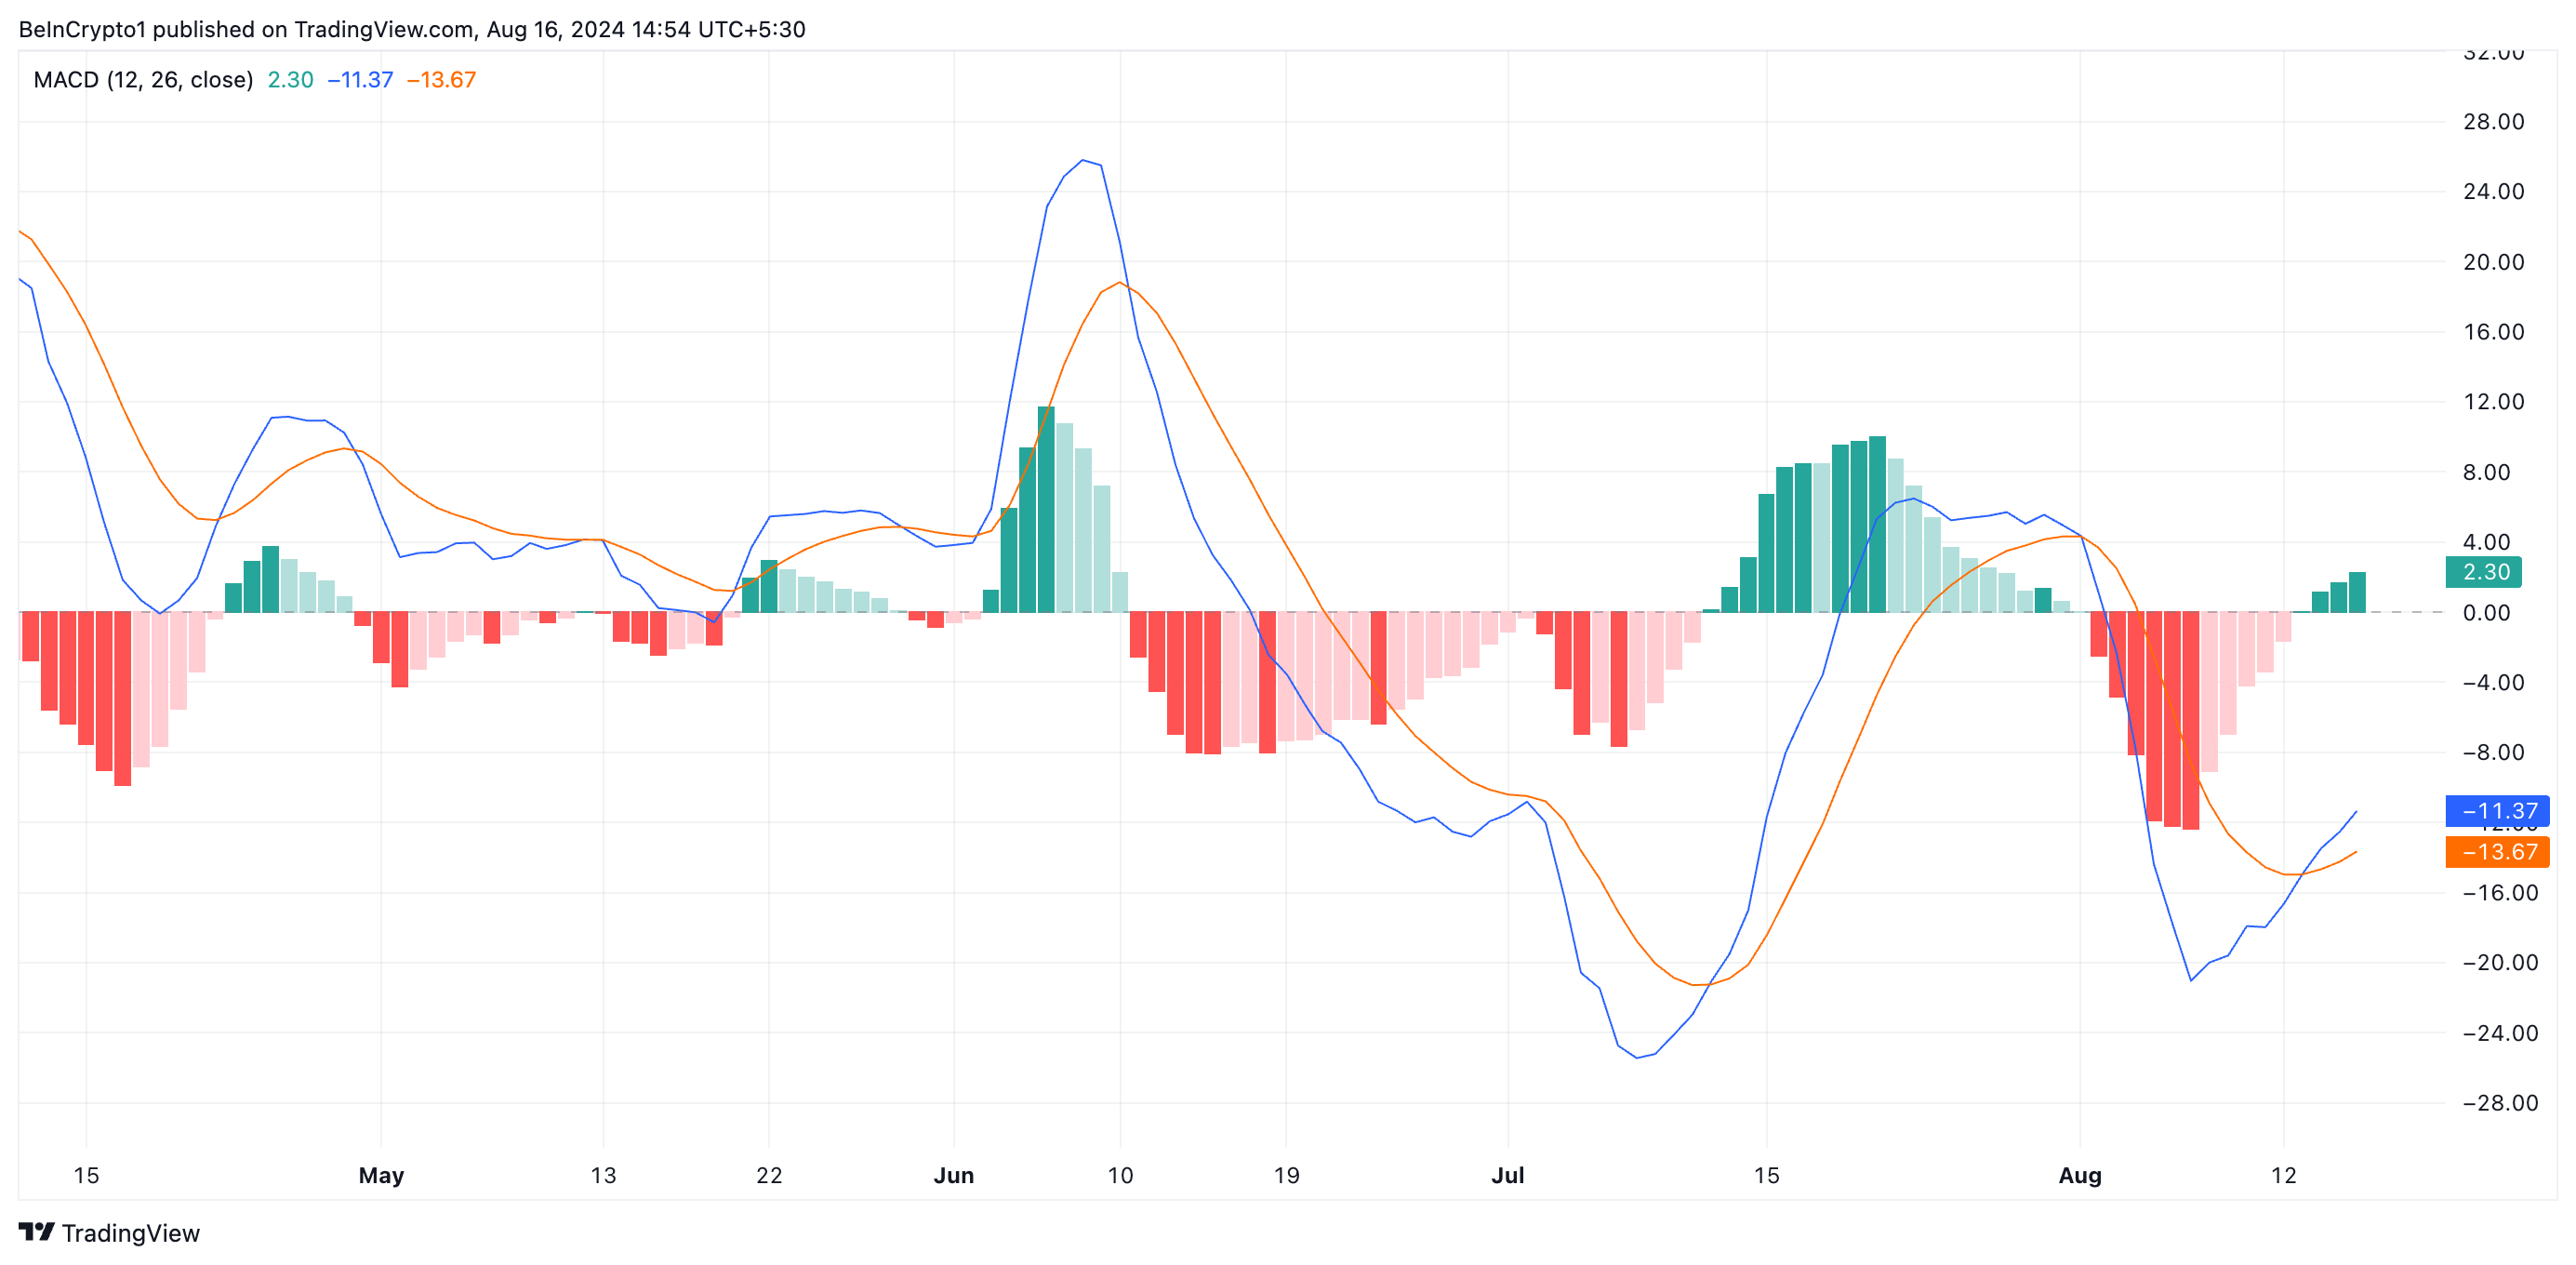
This means that BNB’s shorter-term moving average is rising faster than its longer-term moving average. Traders view this as a bullish signal to go long and exit short positions.
Get to know Godleak
Godleak crypto signal is a service which provide profitable crypto and forex signals for trading. Godleak tried to provide you signals of best crypto vip channels in the world.
It means that you don’t need to buy individual crypto signal vip channels that have expensive prices. We bought all for you and provide you the signals with bot on telegram without even a second of delay.

Godleak crypto leak service have multiple advantages in comparision with other services:
- Providing signal of +160 best crypto vip channels in the world
- Using high tech bot to forward signals
- Without even a second of delay
- Joining in +160 separated channels on telegram
- 1 month, 3 months , 6 months and yearly plans
- Also we have trial to test our services before you pay for anything
For joining Godleak and get more information about us only need to follow godleak bot on telegram and can have access to our free vip channels. click on link bellow and press start button to see all features
Join for Free
☟☟☟☟☟
https://t.me/Godleakbot
Also you can check the list of available vip signal channels in the bot. by pressing Channels button.
 
BNB Price Prediction: a Rally to $561 or a Drop to $476
If buying pressure remains strong enough to push BNB above the horizontal resistance at $524, its price could climb to $561.09, a key target within the ascending triangle pattern. This would signal that buyers have decisively overcome selling pressure, allowing the uptrend to continue.
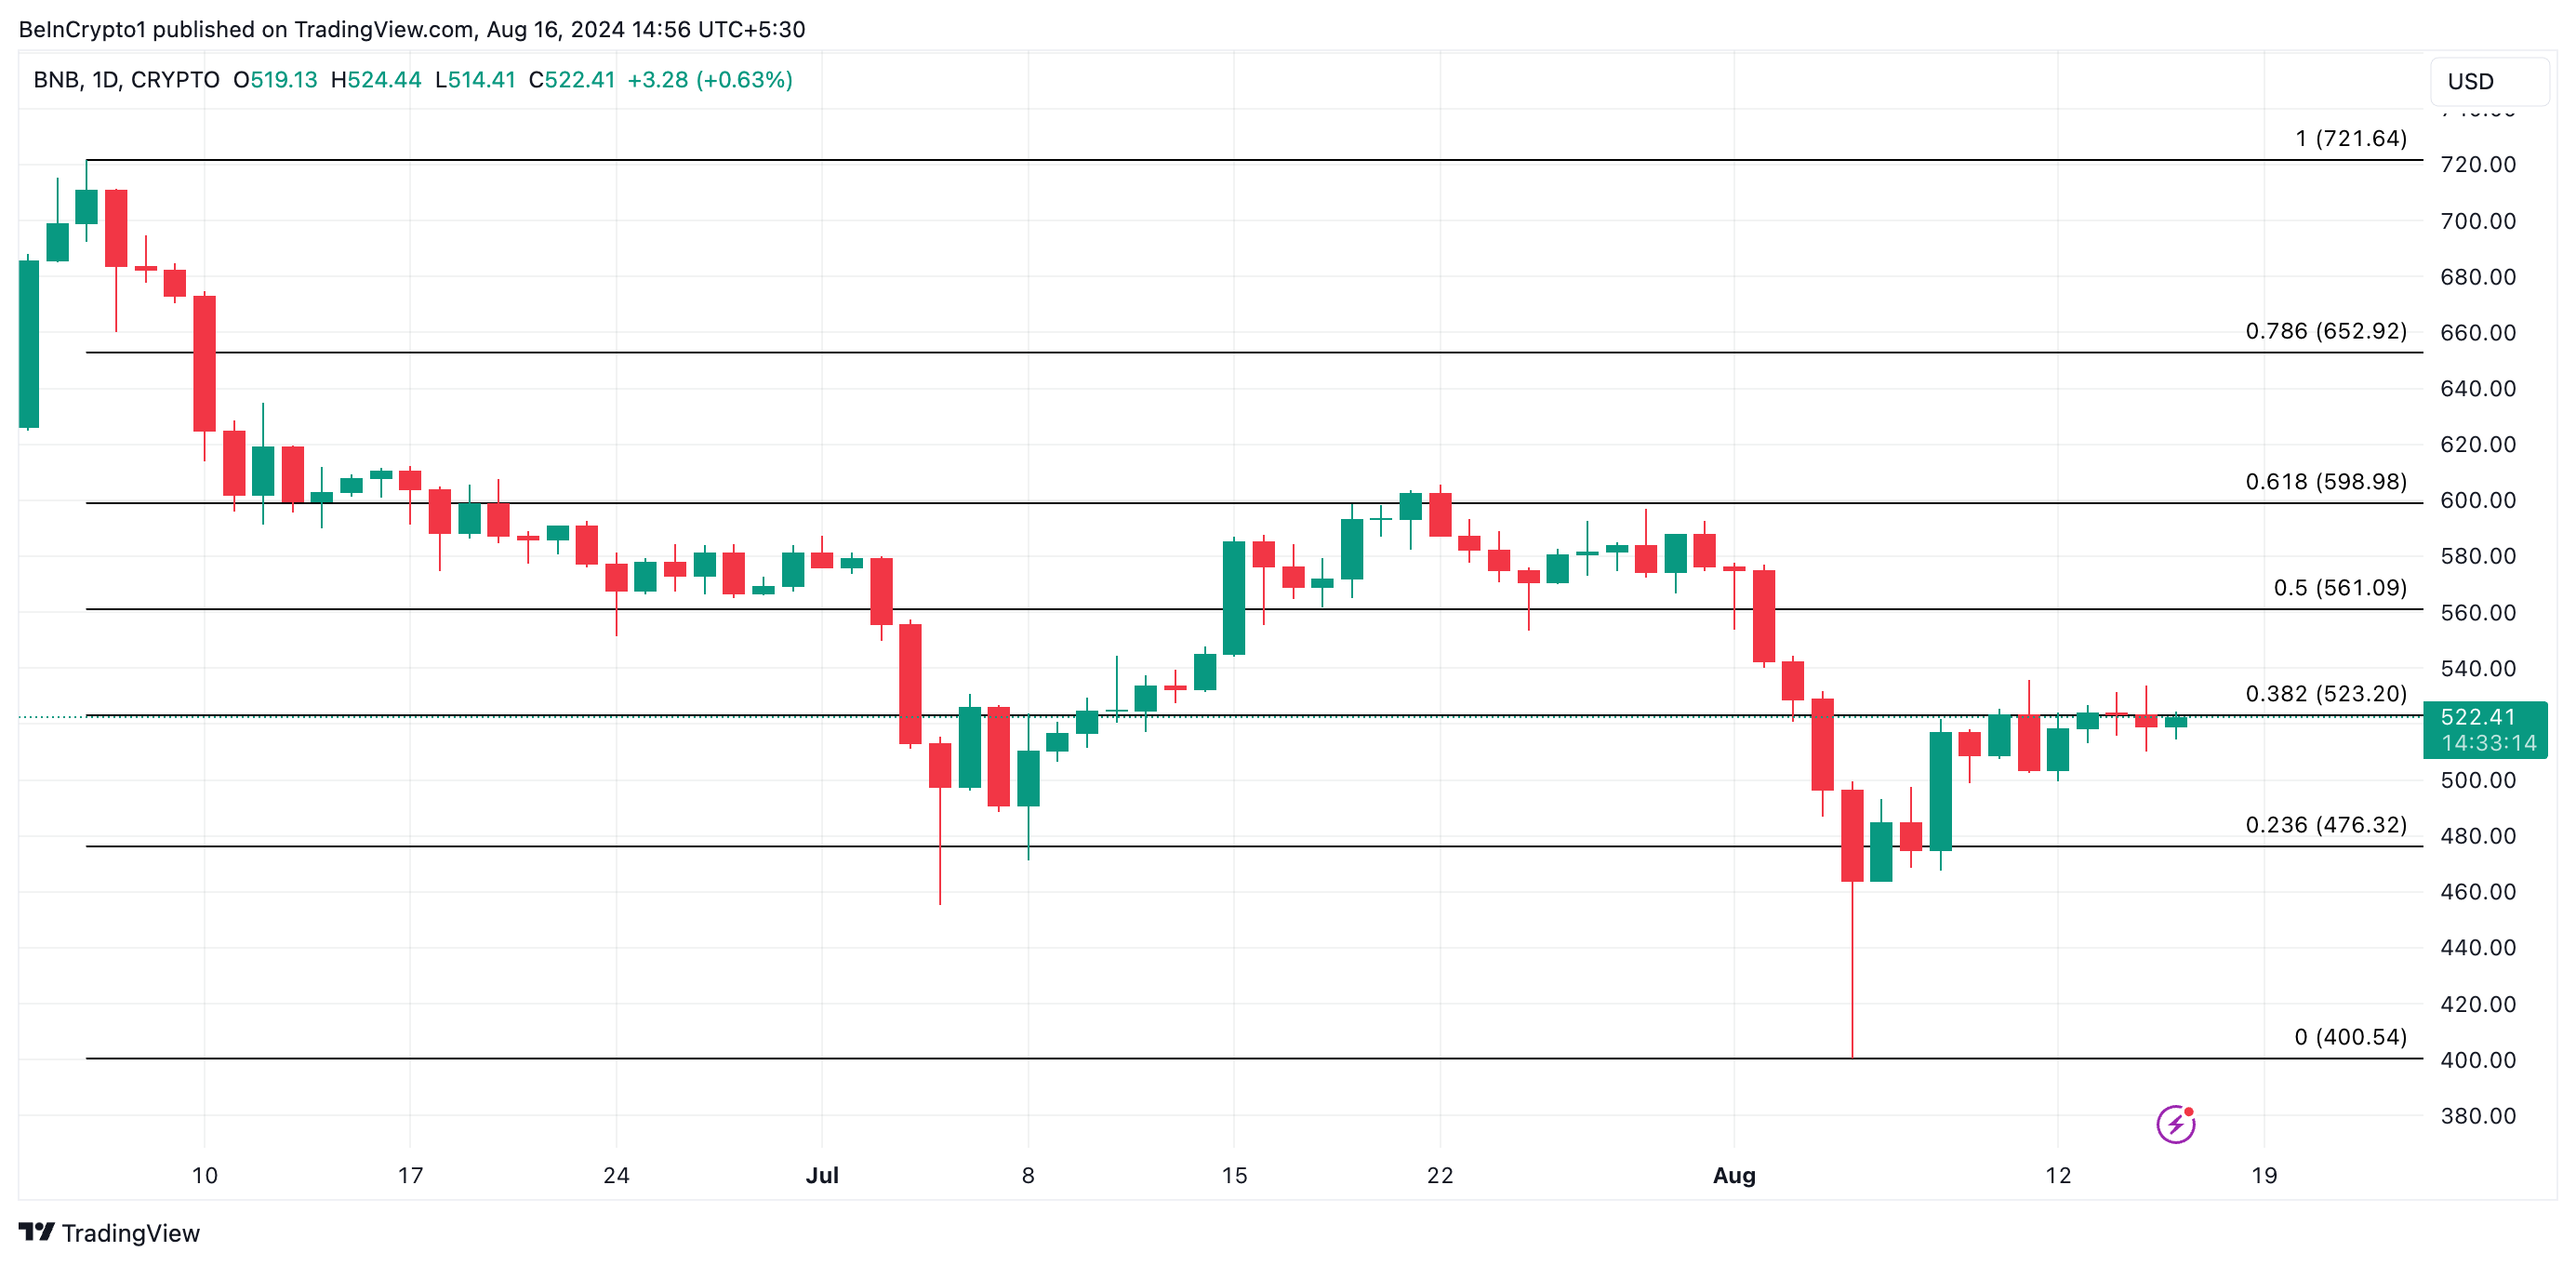
However, a decline in demand at this resistance level could cause BNB’s price to slip below $500, potentially triggering further selling. If bearish momentum intensifies, BNB could face a deeper pullback to $476.32, a critical support level where buyers might attempt to regain control.


