
Cardano (ADA) Price Shows Two Reversal Patterns: Will Bulls Finally Take Over?

- Whales added 50 million ADA worth around $32.5 million, showing slow but steady accumulation.
- Spent Coins Age Band dropped 36%, signaling early dormancy but not full conviction among holders.
- Inverse head and shoulders and bullish RSI divergence hint at reversal, but a break above $0.66 is crucial to confirm it.
Cardano (ADA) price has been trading quietly, up just 2.2% over the past week. But this sideways movement might not last much longer. On-chain data shows whales are back in action, while broader market conditions suggest the network could be preparing for a shift in direction.
The next few days may decide whether this slow buildup turns into a full reversal or fades like previous attempts.
Whales Add as Dormancy Starts to Build
Over the past two days, Cardano whales holding between 10 million and 100 million ADA have been quietly increasing their holdings. Their combined stash rose from 13.16 billion to 13.21 billion ADA, meaning an addition of about 50 million ADA, worth nearly $32.5 million at current prices.
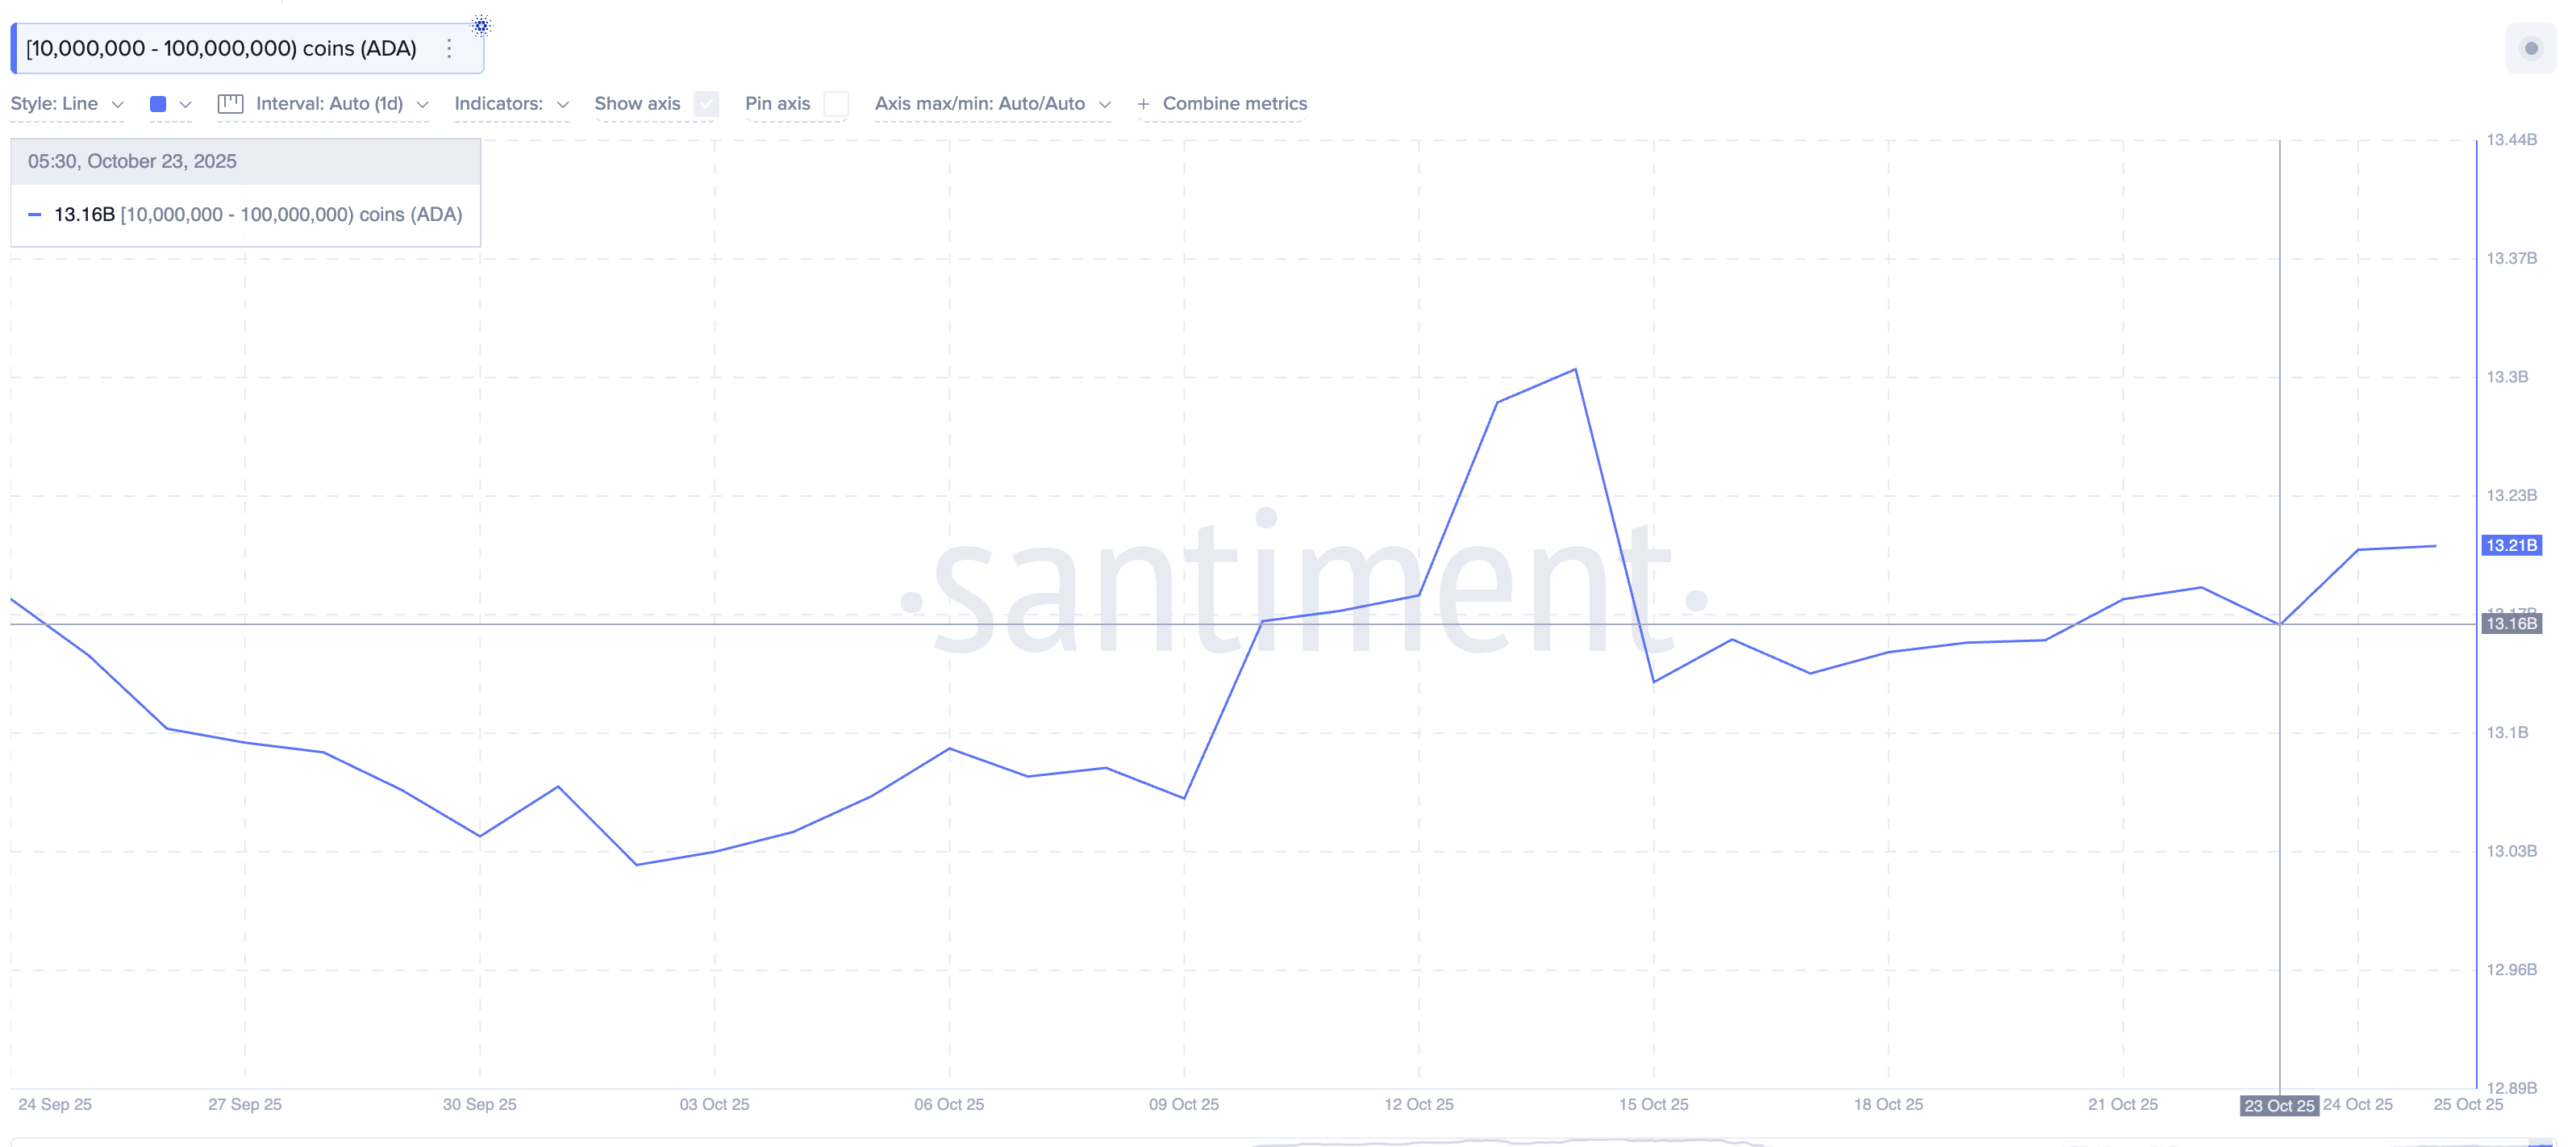
The pace of accumulation remains steady but not yet aggressive. To confirm conviction, this buying trend needs to accelerate in the coming sessions.
At the same time, the Spent Coins Age Band — a metric that tracks how much ADA moves across all wallet age groups — has declined from 179.16 million ADA on October 11 to 114.71 million ADA on October 25, marking a 36% drop.
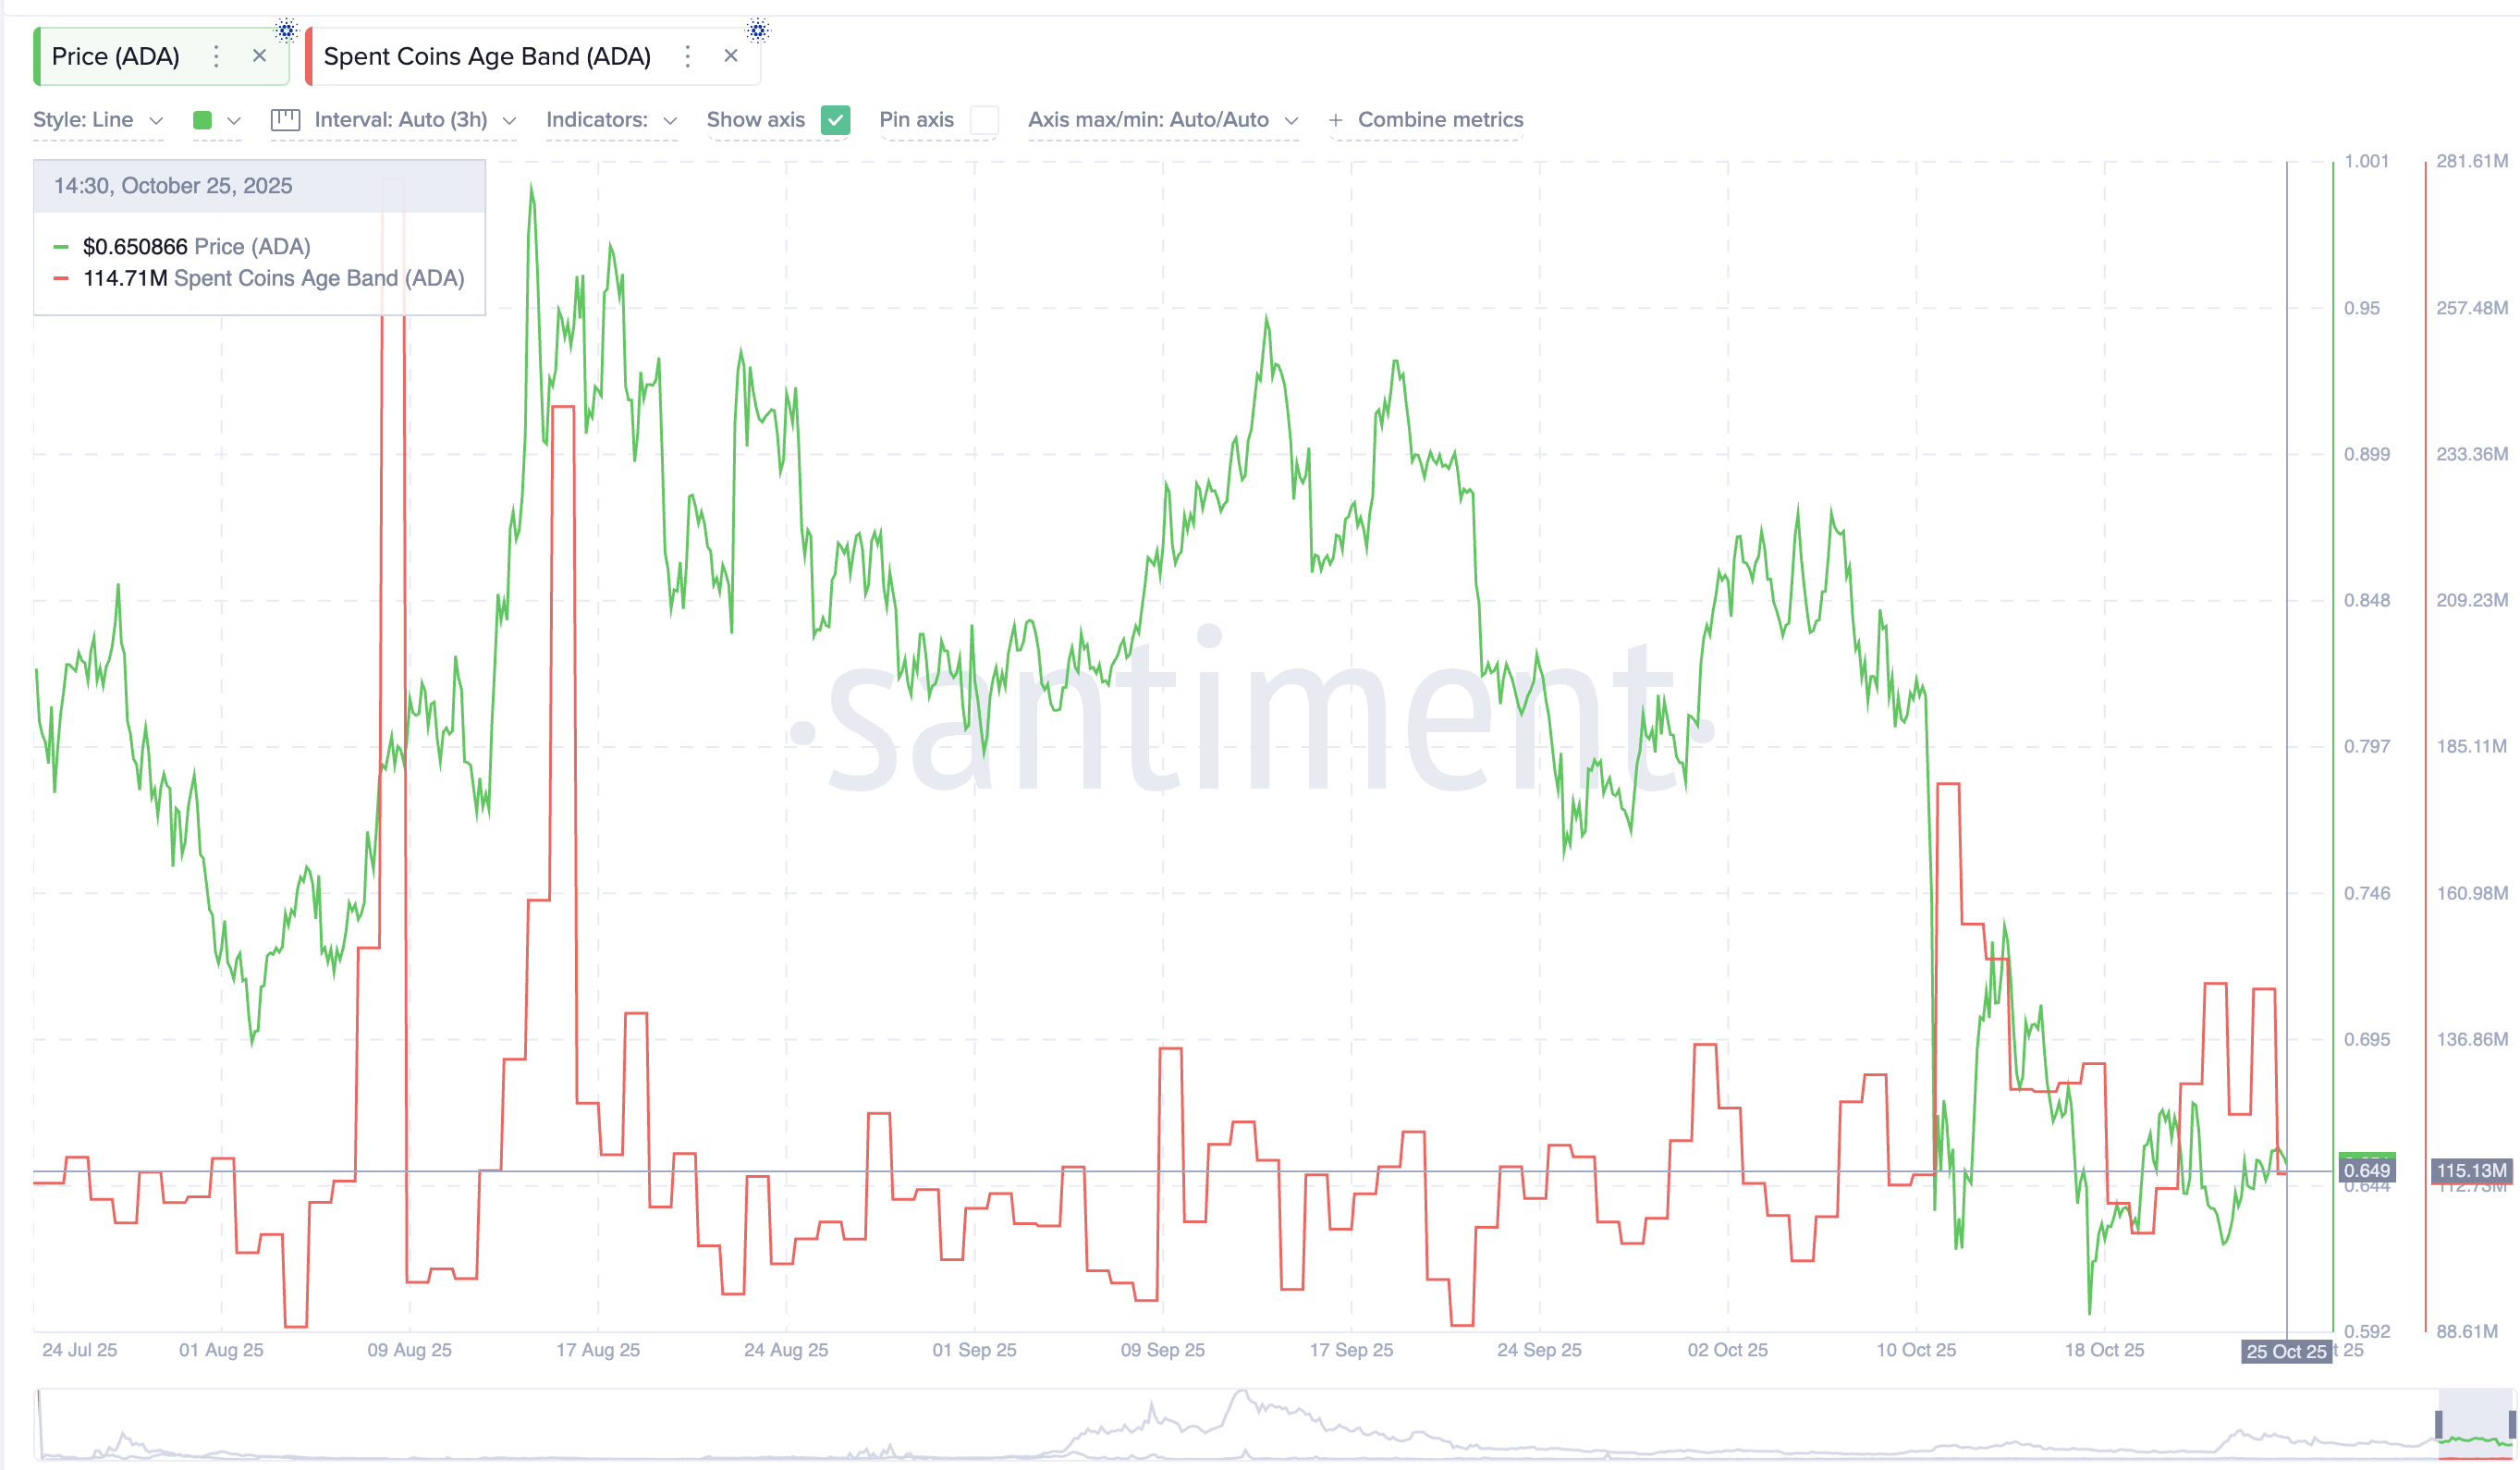
This drop means fewer coins are changing hands, showing early signs of rising dormancy. However, it hasn’t yet reached the kind of deep holder inactivity that usually marks the start of strong rallies.
The current figure is still well above the local low of 89.22 million ADA from September 22. This low triggered the last short-lived bounce. In short, dormancy is improving, but it needs to fall closer to the under-90-million ADA range. That would confirm a true accumulation phase.
Together, slow whale accumulation and partial dormancy improvement hint at a base forming, but confirmation still depends on how the Cardano price reacts near a critical resistance zone.
Get to know Godleak
Godleak crypto signal is a service which provide profitable crypto and forex signals for trading. Godleak tried to provide you signals of best crypto vip channels in the world.
It means that you don’t need to buy individual crypto signal vip channels that have expensive prices. We bought all for you and provide you the signals with bot on telegram without even a second of delay.

Godleak crypto leak service have multiple advantages in comparision with other services:
- Providing signal of +160 best crypto vip channels in the world
- Using high tech bot to forward signals
- Without even a second of delay
- Joining in +160 separated channels on telegram
- 1 month, 3 months , 6 months and yearly plans
- Also we have trial to test our services before you pay for anything
For joining Godleak and get more information about us only need to follow godleak bot on telegram and can have access to our free vip channels. click on link bellow and press start button to see all features
Join for Free
☟☟☟☟☟
https://t.me/Godleakbot
Also you can check the list of available vip signal channels in the bot. by pressing Channels button.
 
Cardano Price Holds Near Breakout Zone as Reversal Signals Strengthen
On the daily chart, the ADA price is forming a potential inverse head-and-shoulders pattern with a sloping neckline, a formation often seen before bullish reversals. The downward-sloping neckline suggests that sellers are still active, but ADA’s resilience near this level is encouraging.
The coin currently trades near $0.65, sitting right below the 0.236 Fibonacci retracement level at $0.66. A clean daily close above $0.66 could confirm a breakout, potentially sending prices toward $0.79, the pattern’s projected target. Extended upside zones lie at $0.83 and $0.89.
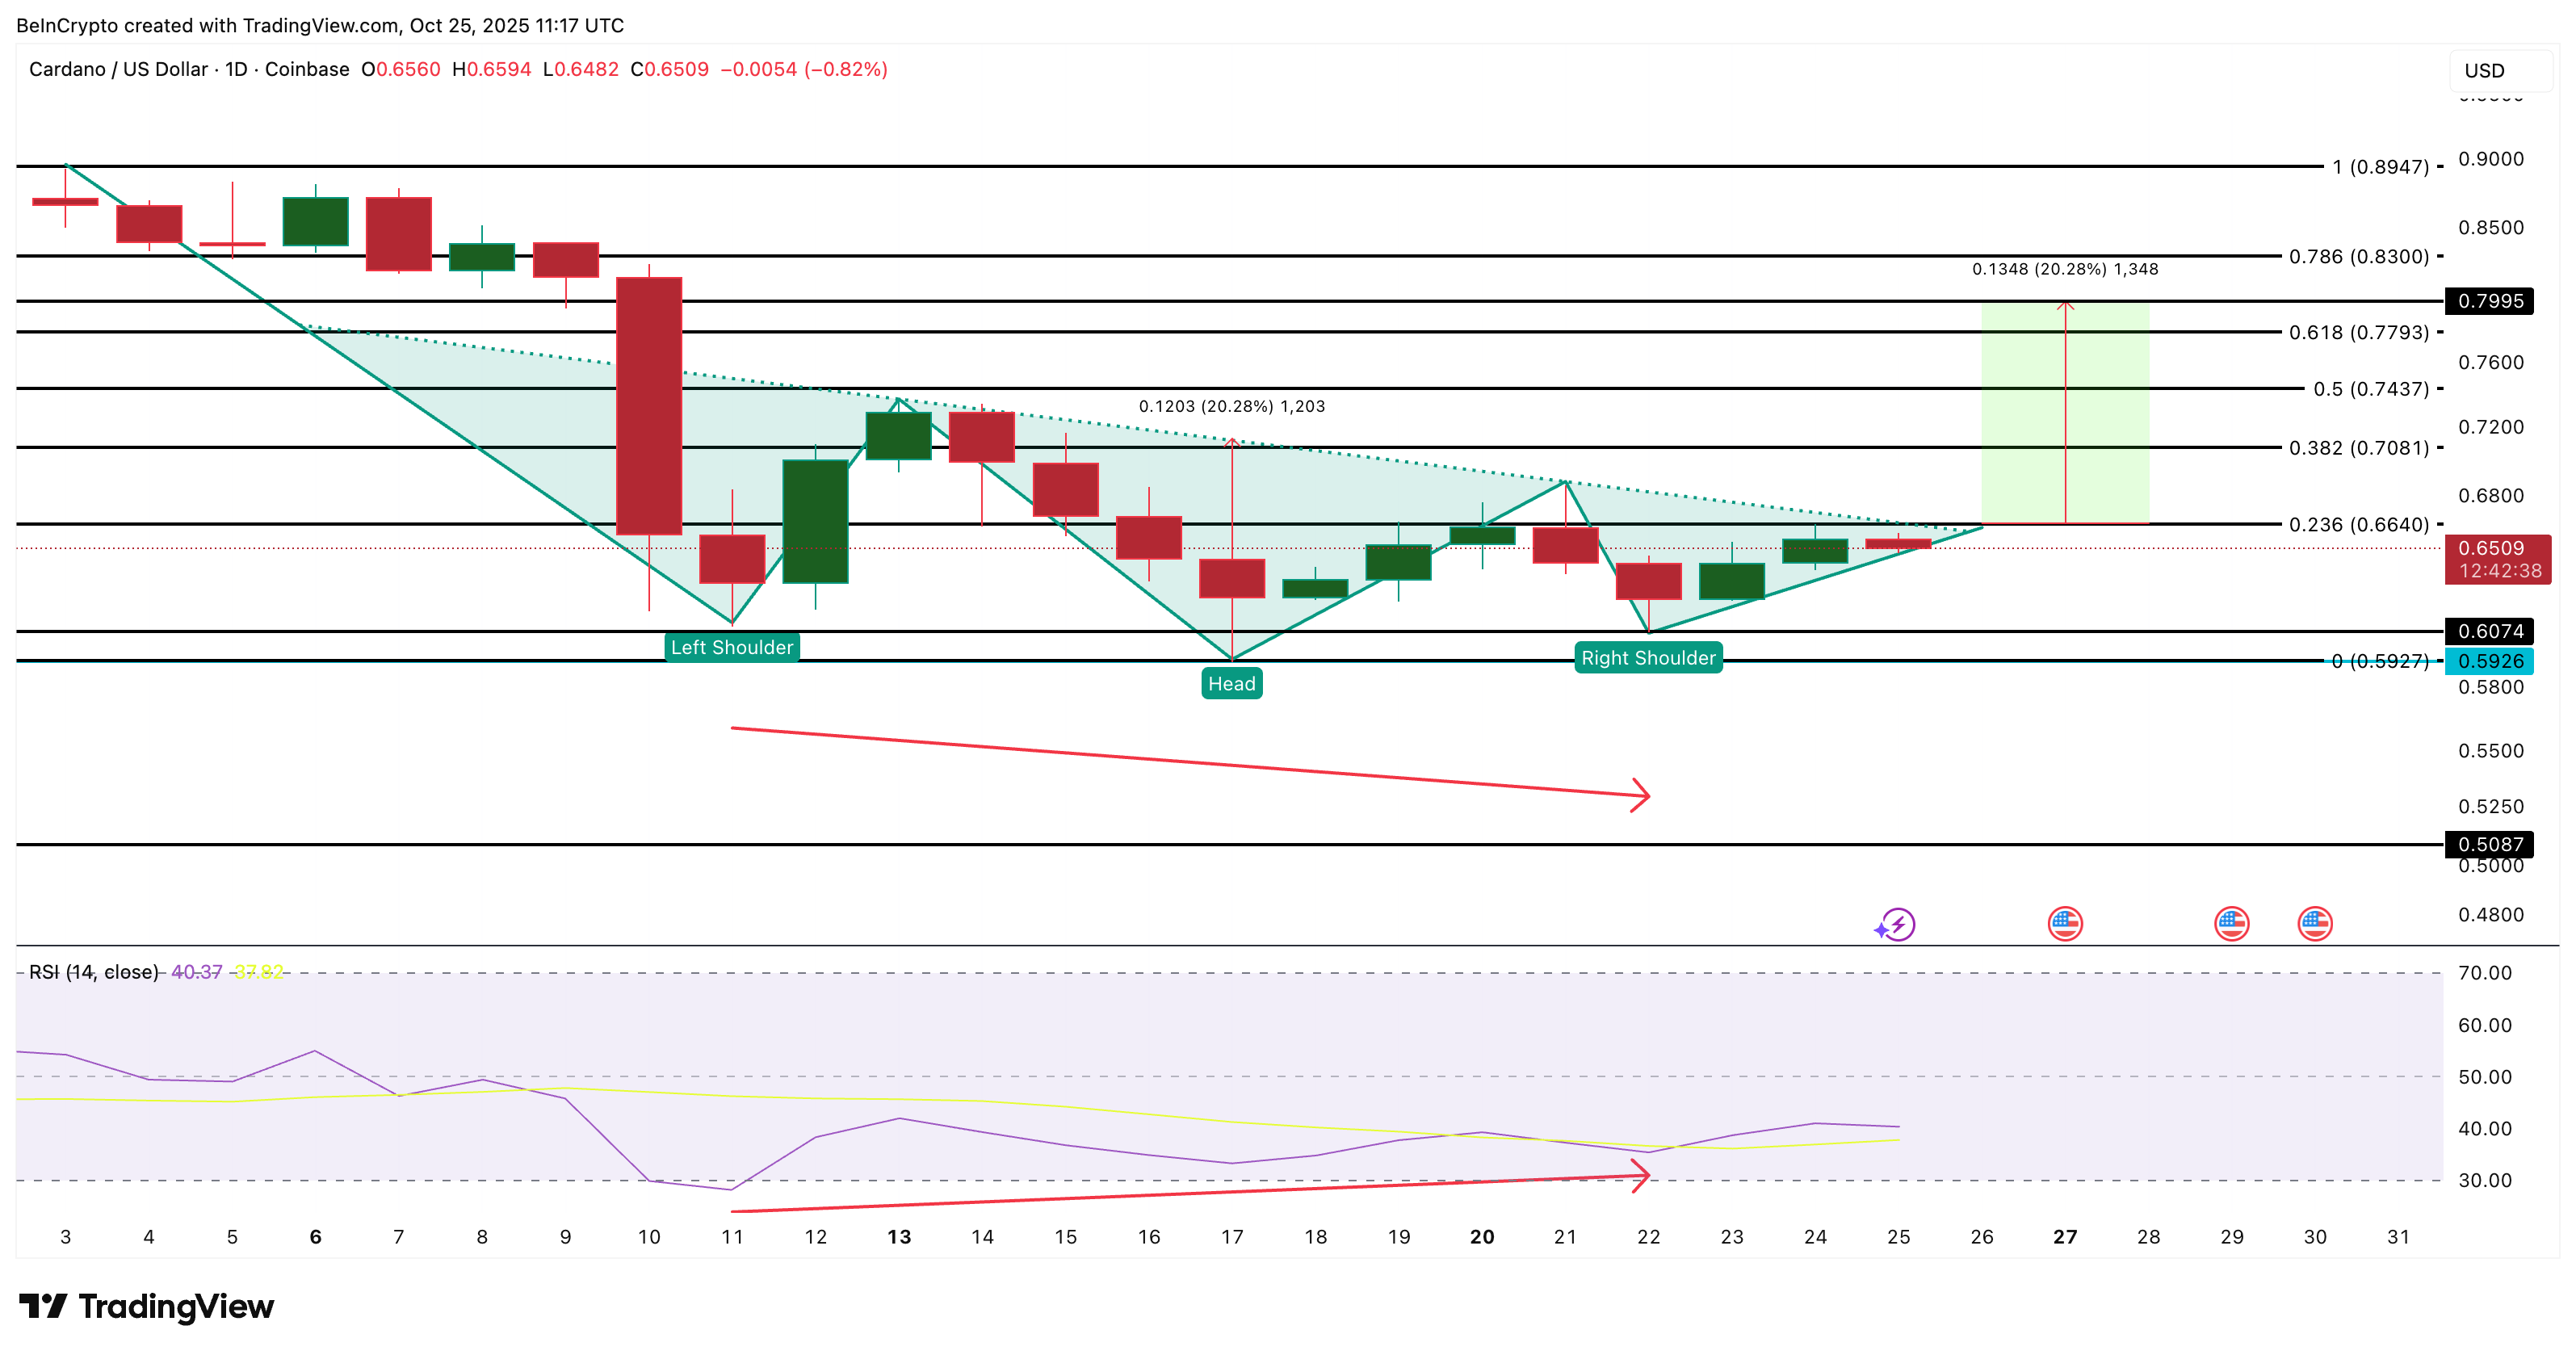
Adding weight to this setup, the RSI (Relative Strength Index). This indicator, measuring the balance between buying and selling strength, shows a bullish divergence.
Between October 11 and 22, the RSI made a higher low while the Cardano price formed a lower low, a classical bullish divergence. This suggests that selling pressure is weakening and buying strength is returning. This kind of divergence, on the daily timeframe, often leads to a down-to-uptrend shift.
The combination of the bullish RSI signal and the inverse head and shoulders structure gives ADA a solid technical case for a reversal.
But the downward-sloping neckline remains a risk. If the price fails to hold above $0.60, the structure invalidates, potentially pushing ADA down to $0.50 — a key support.


