
Ethereum Whales Fell Into a $4 Billion Bull Trap: What’s Next for ETH Price?

- Ethereum’s breakout failed as a $4 billion wall absorbed demand and triggered a bull trap.
- Whale accumulation could not offset ETF outflows and heavy sell zone above $3,407.
- ETH must reclaim $3,180 or risk deeper downside below the $2,773 support zone.
Ethereum is down nearly 1% over the past 24 hours. That move alone is not important. What matters is what happened before it.
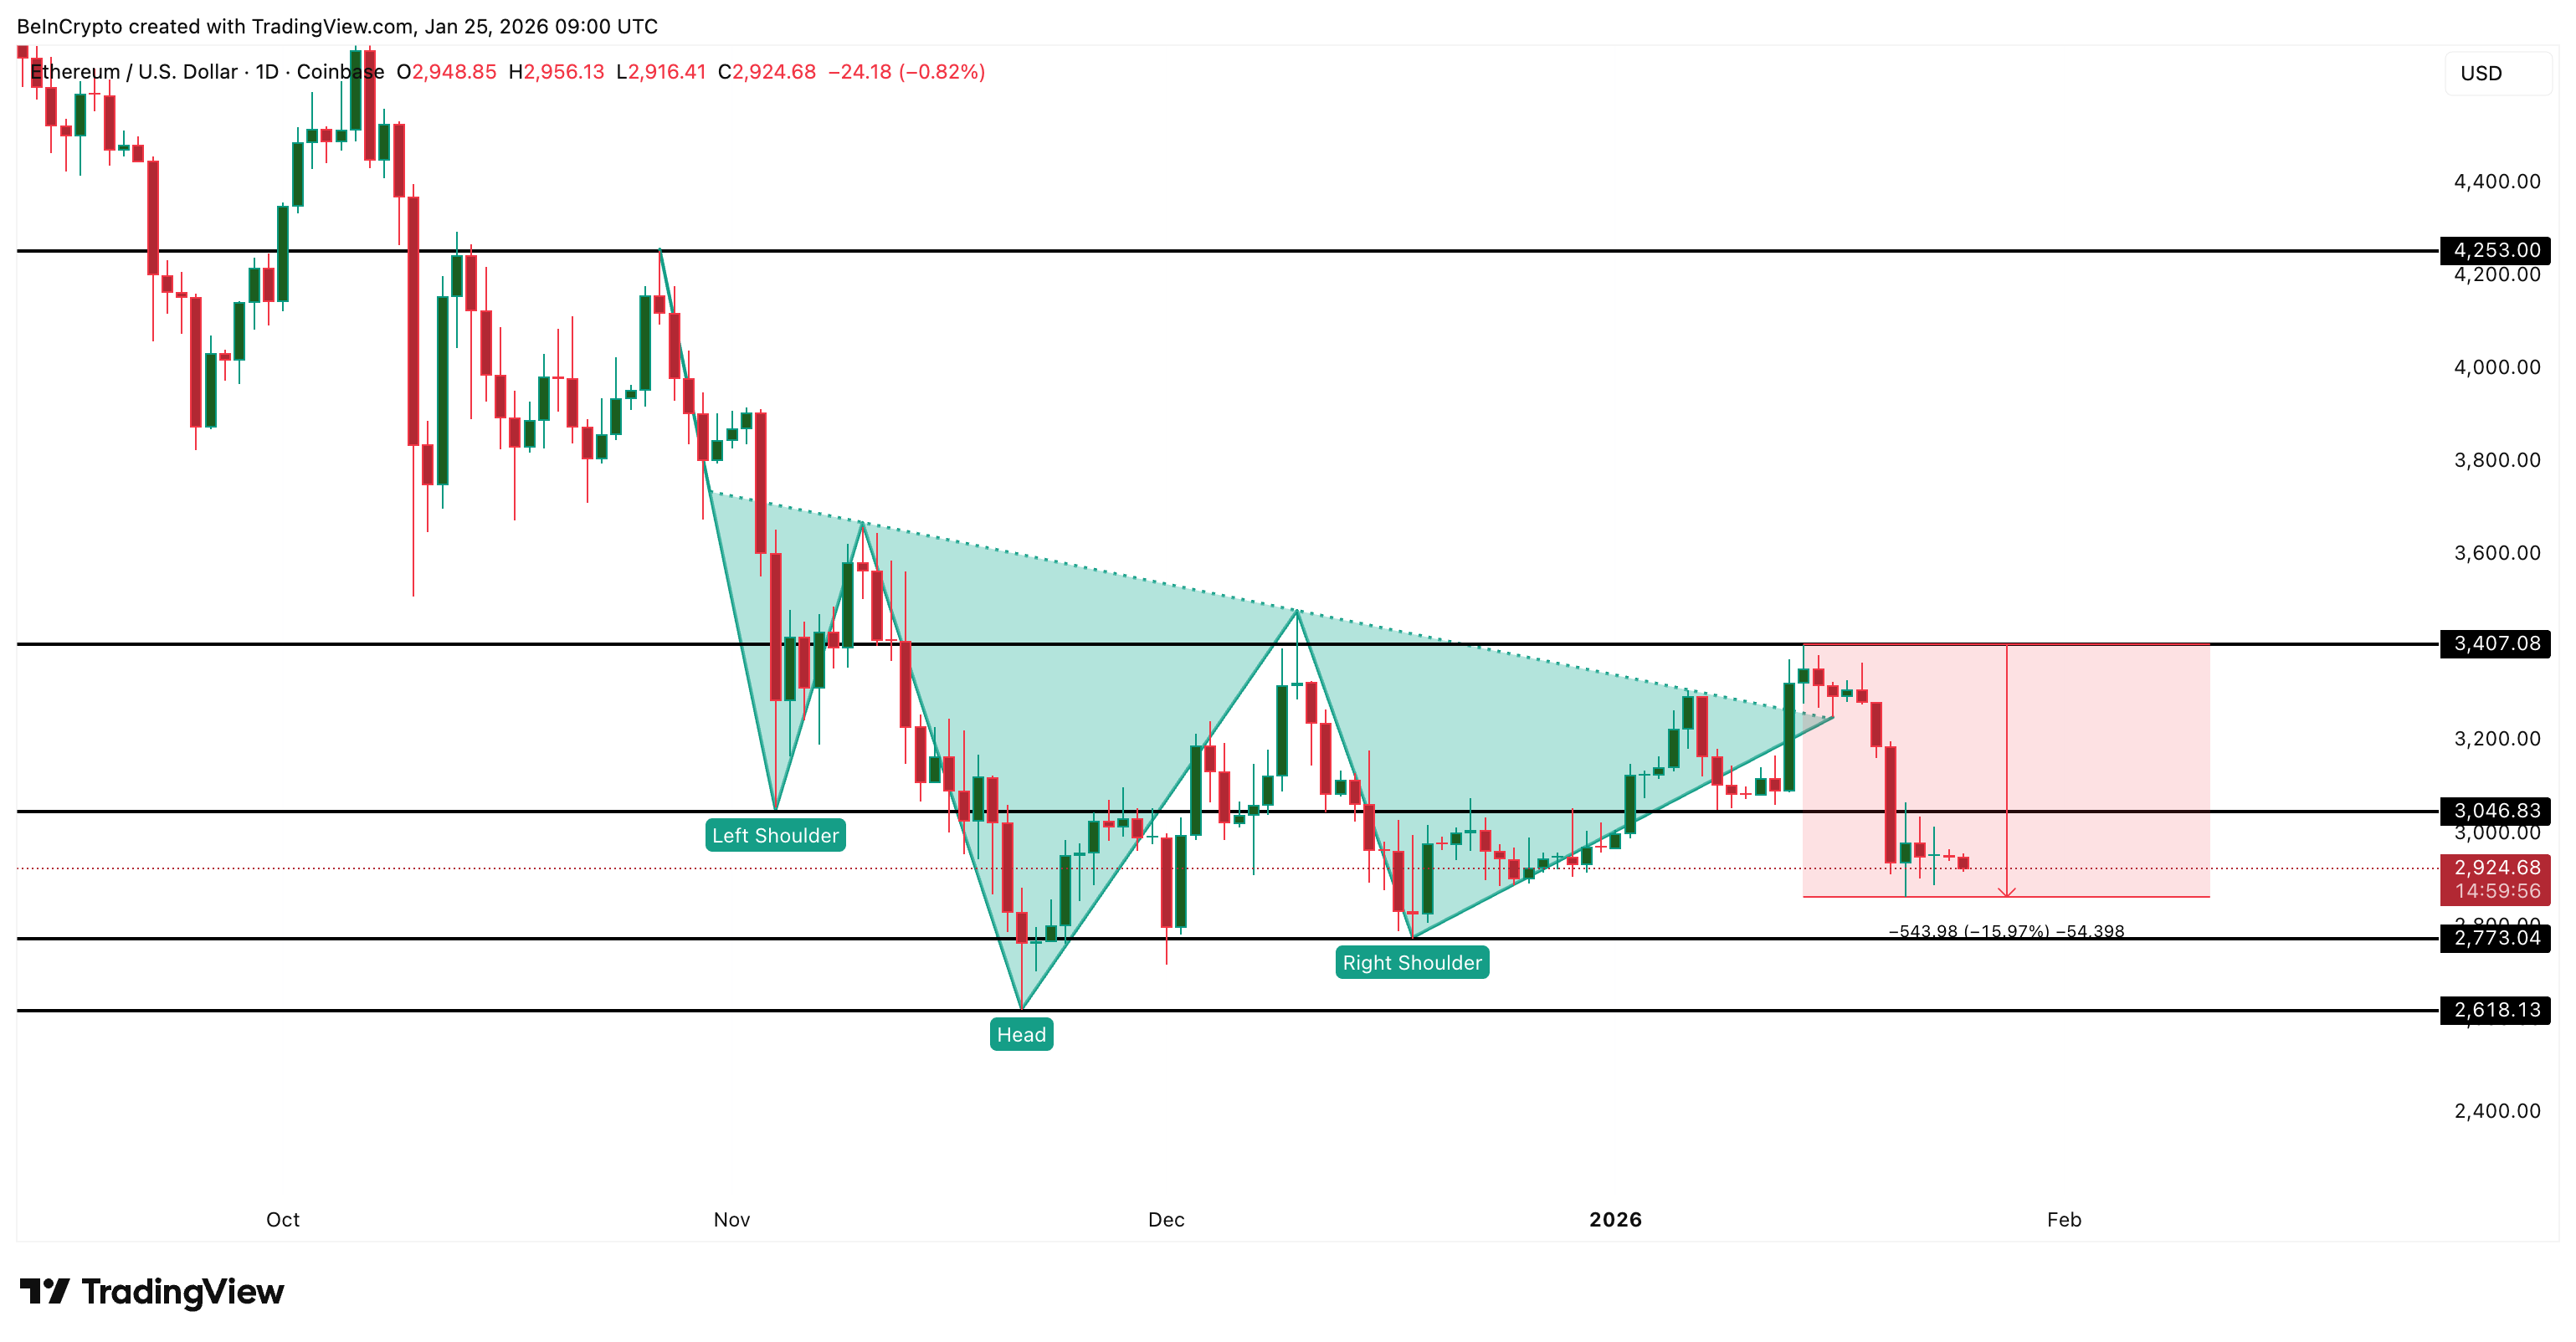
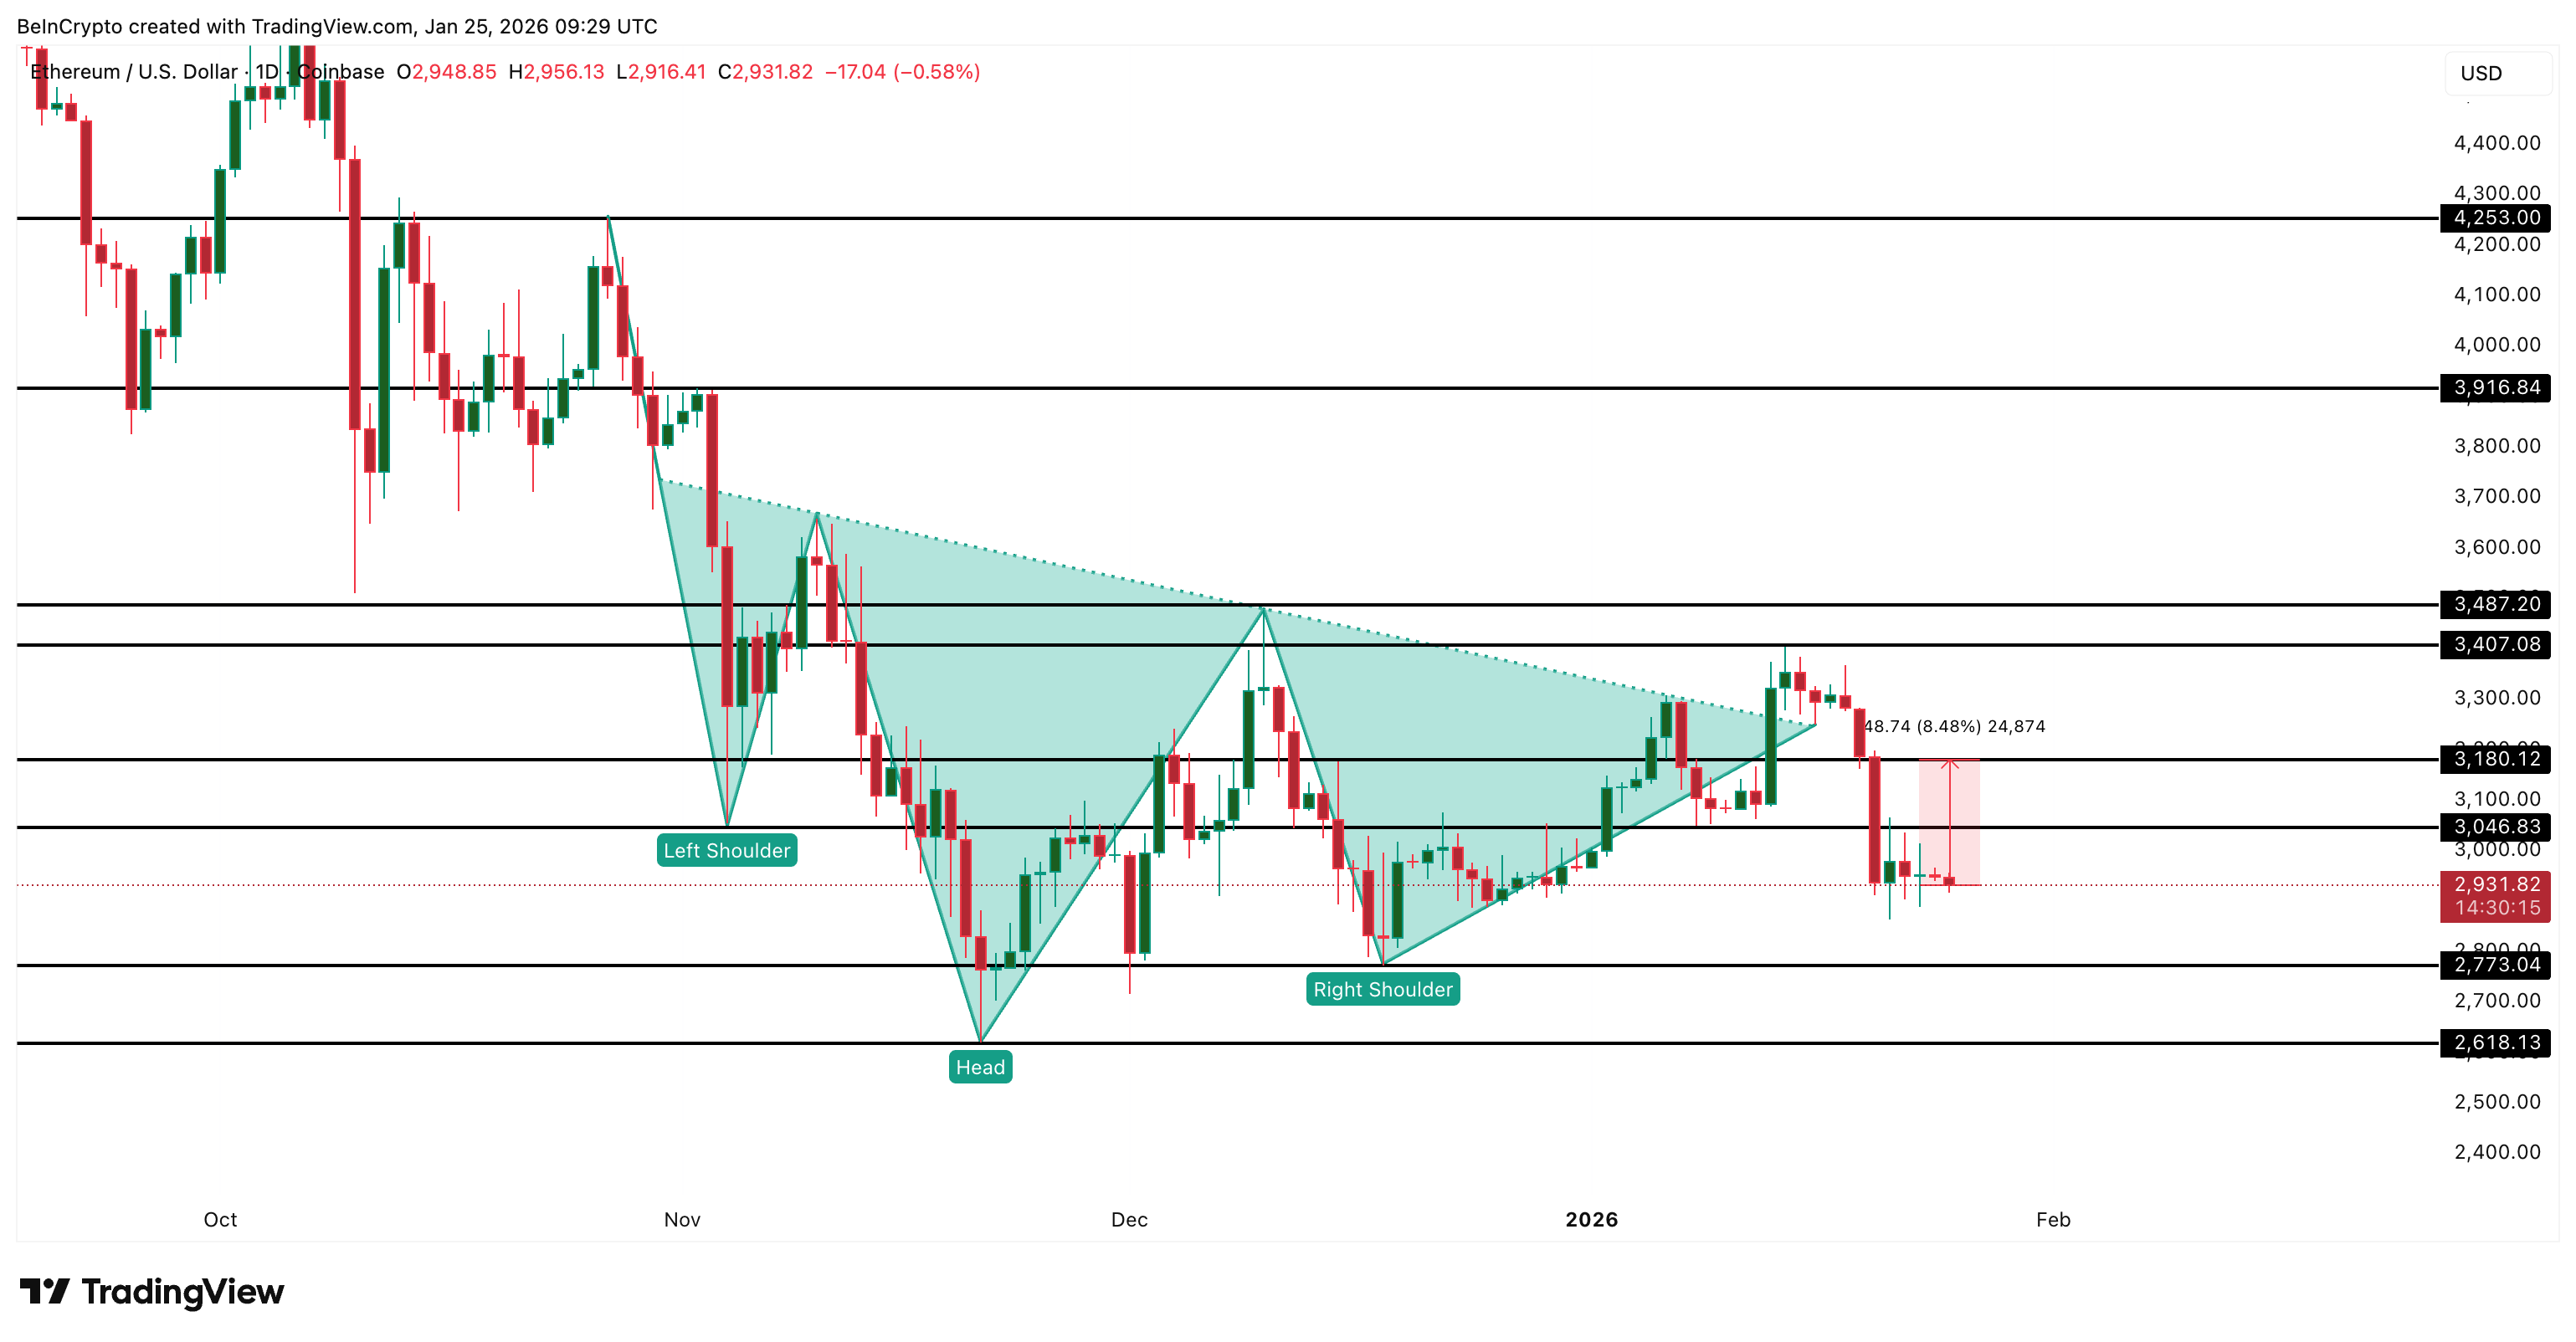
In mid-January, Ethereum broke out from a well-defined inverse head-and-shoulders pattern. The setup looked constructive. Momentum was improving, whales were buying, and the price cleared a key structure. Under normal conditions, that combination supports continuation.
Instead, Ethereum stalled near a critical wall and has since corrected by almost 16%. This was not a random failure. A supply wall, worth roughly $4 billion, quietly absorbed demand, turning the breakout into a classic bull trap.
A Breakout That Ran Straight Towards The $4 Billion Wall
Ethereum’s inverse head-and-shoulders pattern began forming in late October. The breakout was confirmed on January 13, when the ETH price pushed above the neckline and moved higher with confidence.
That move did not fail because buyers disappeared.
It failed because the price ran into a dense cost-basis wall.
Cost-basis data shows a large cluster of Ethereum holders between $3,490 and $3,510. Roughly 1,190,317 ETH were accumulated in this zone. At an average price near $3,500, that represents about $4.1 billion in supply.
A cost-basis wall forms when a large amount of ETH was previously bought in a tight price range. When price revisits that zone or even gets close to that, holders often sell to break even. That kind of early distribution creates heavy resistance, even if sentiment looks bullish.
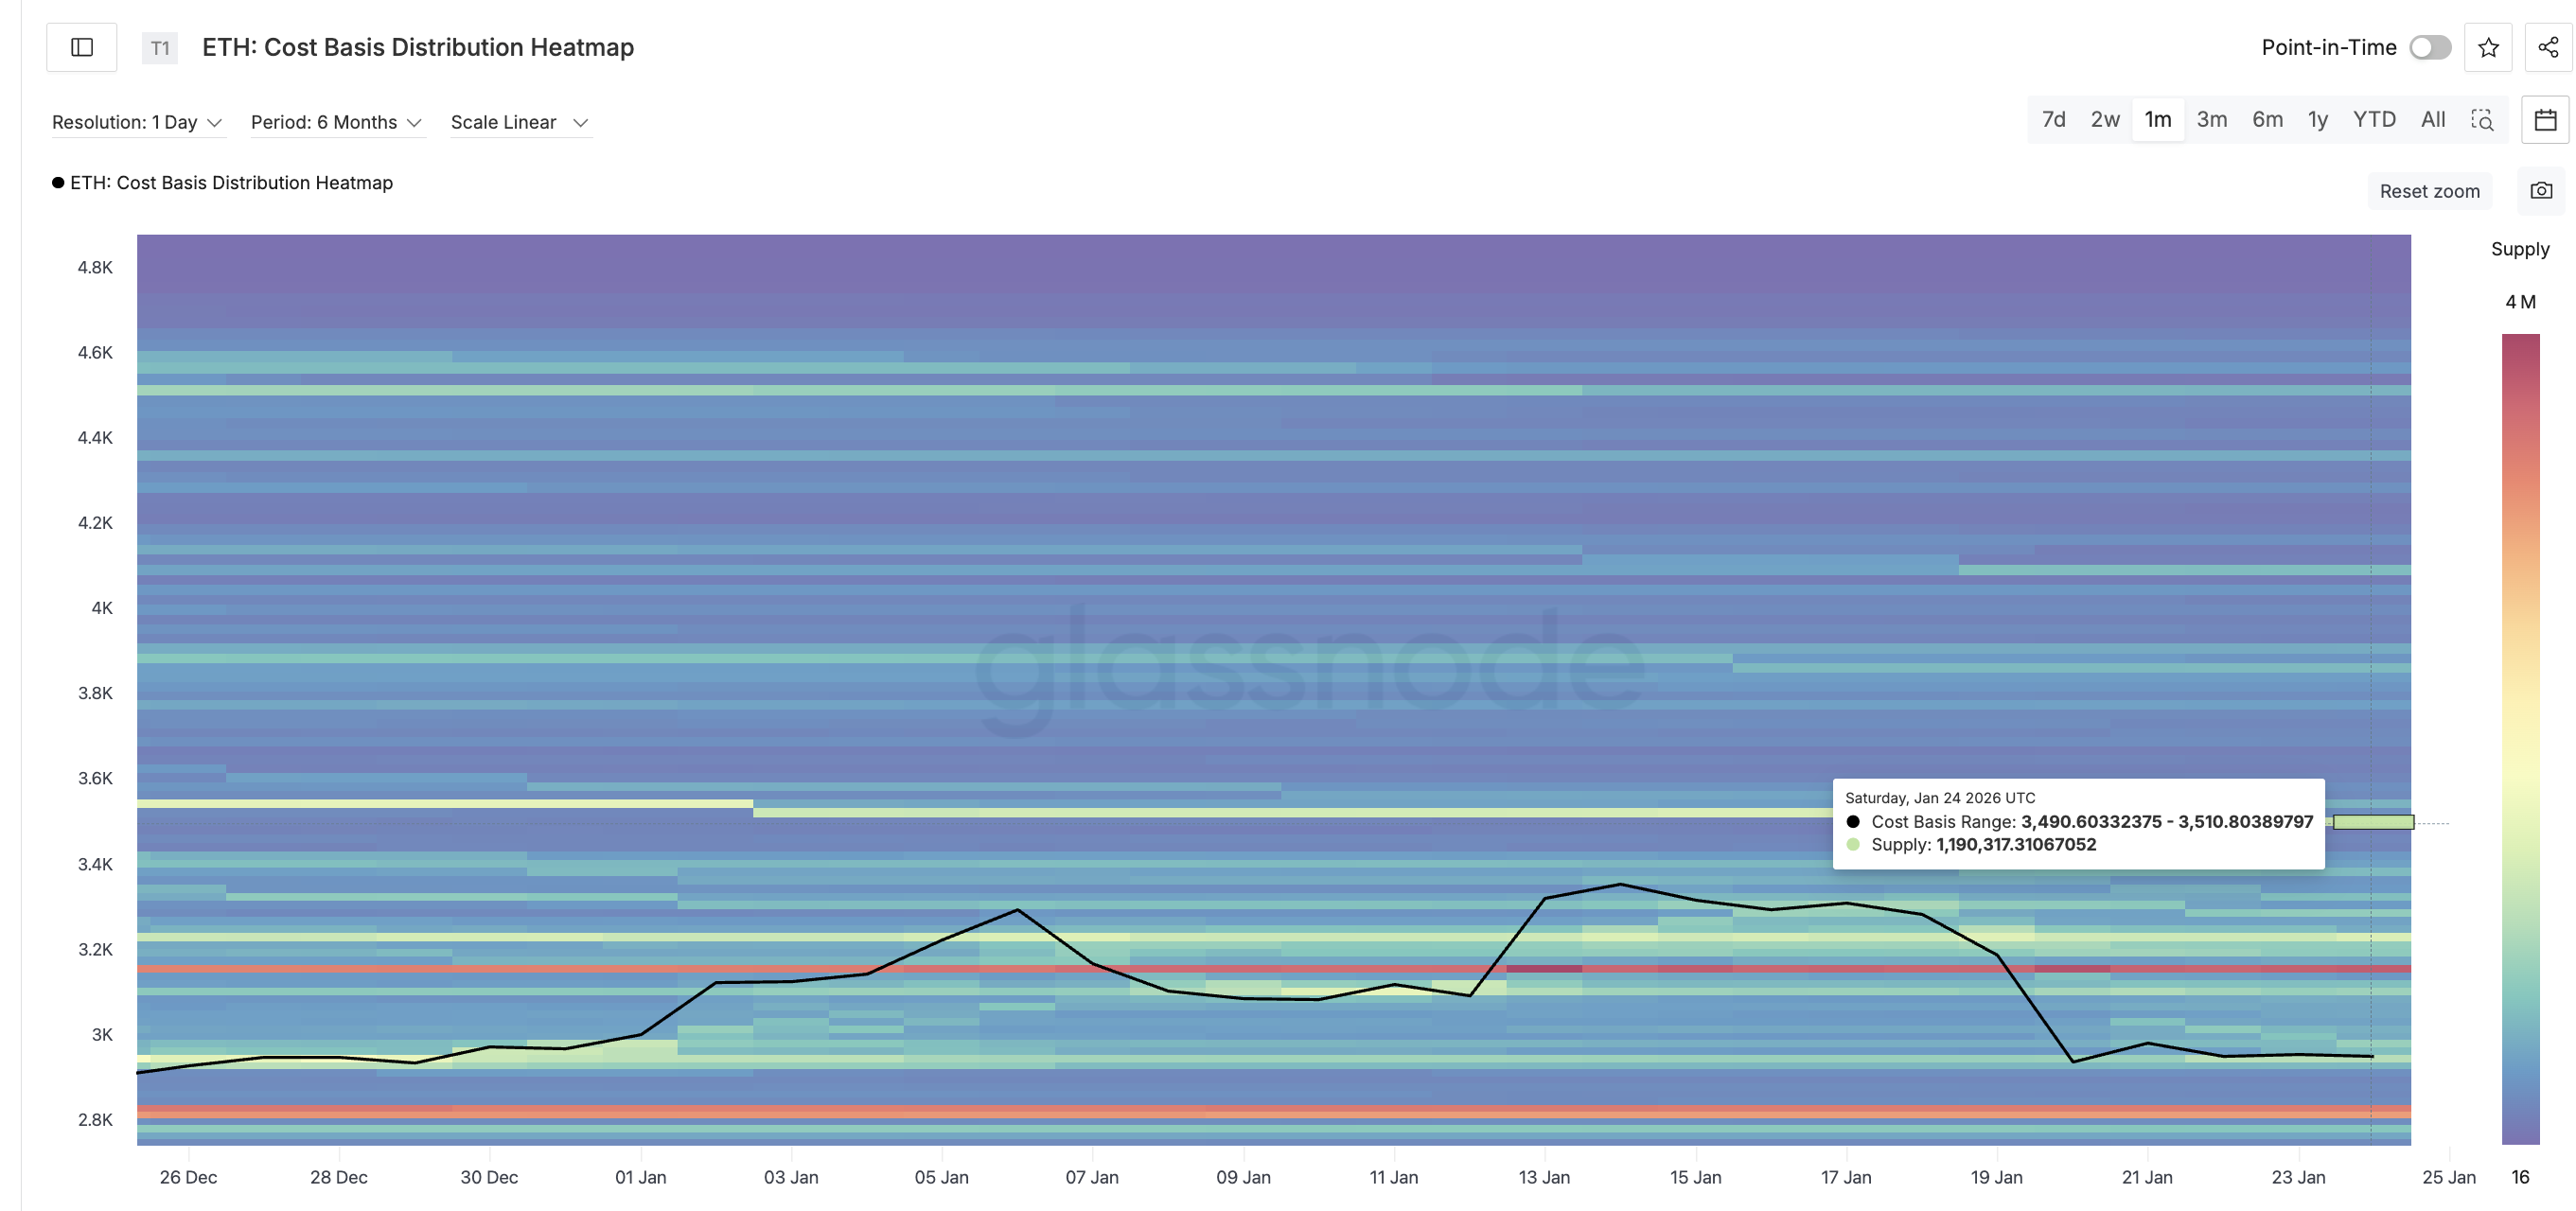
That is exactly what happened near $3,407, where the sell pressure derailed the breakout.
Ethereum pushed close to the wall, stalled, and rolled over. The breakout technically held for a moment, but structurally it was already compromised. The supply overhead was simply too large. And it trapped a key cohort in the process!
Get to know Godleak
Godleak crypto signal is a service which provide profitable crypto and forex signals for trading. Godleak tried to provide you signals of best crypto vip channels in the world.
It means that you don’t need to buy individual crypto signal vip channels that have expensive prices. We bought all for you and provide you the signals with bot on telegram without even a second of delay.

Godleak crypto leak service have multiple advantages in comparision with other services:
- Providing signal of +160 best crypto vip channels in the world
- Using high tech bot to forward signals
- Without even a second of delay
- Joining in +160 separated channels on telegram
- 1 month, 3 months , 6 months and yearly plans
- Also we have trial to test our services before you pay for anything
For joining Godleak and get more information about us only need to follow godleak bot on telegram and can have access to our free vip channels. click on link bellow and press start button to see all features
Join for Free
☟☟☟☟☟
https://t.me/Godleakbot
Also you can check the list of available vip signal channels in the bot. by pressing Channels button.
 
Whales Bought the Breakout — And Got Trapped
What makes this setup more dangerous is that ETH whales did the “right” thing.
From January 15 onward (post-breakout confirmation), large holders steadily increased exposure. Whale balances rose from roughly 103.11 million ETH to 104.15 million ETH, an addition of about 1.04 million ETH or close to $3 billion.
That buying continued even as price began to roll over, showing clear averaging behavior.
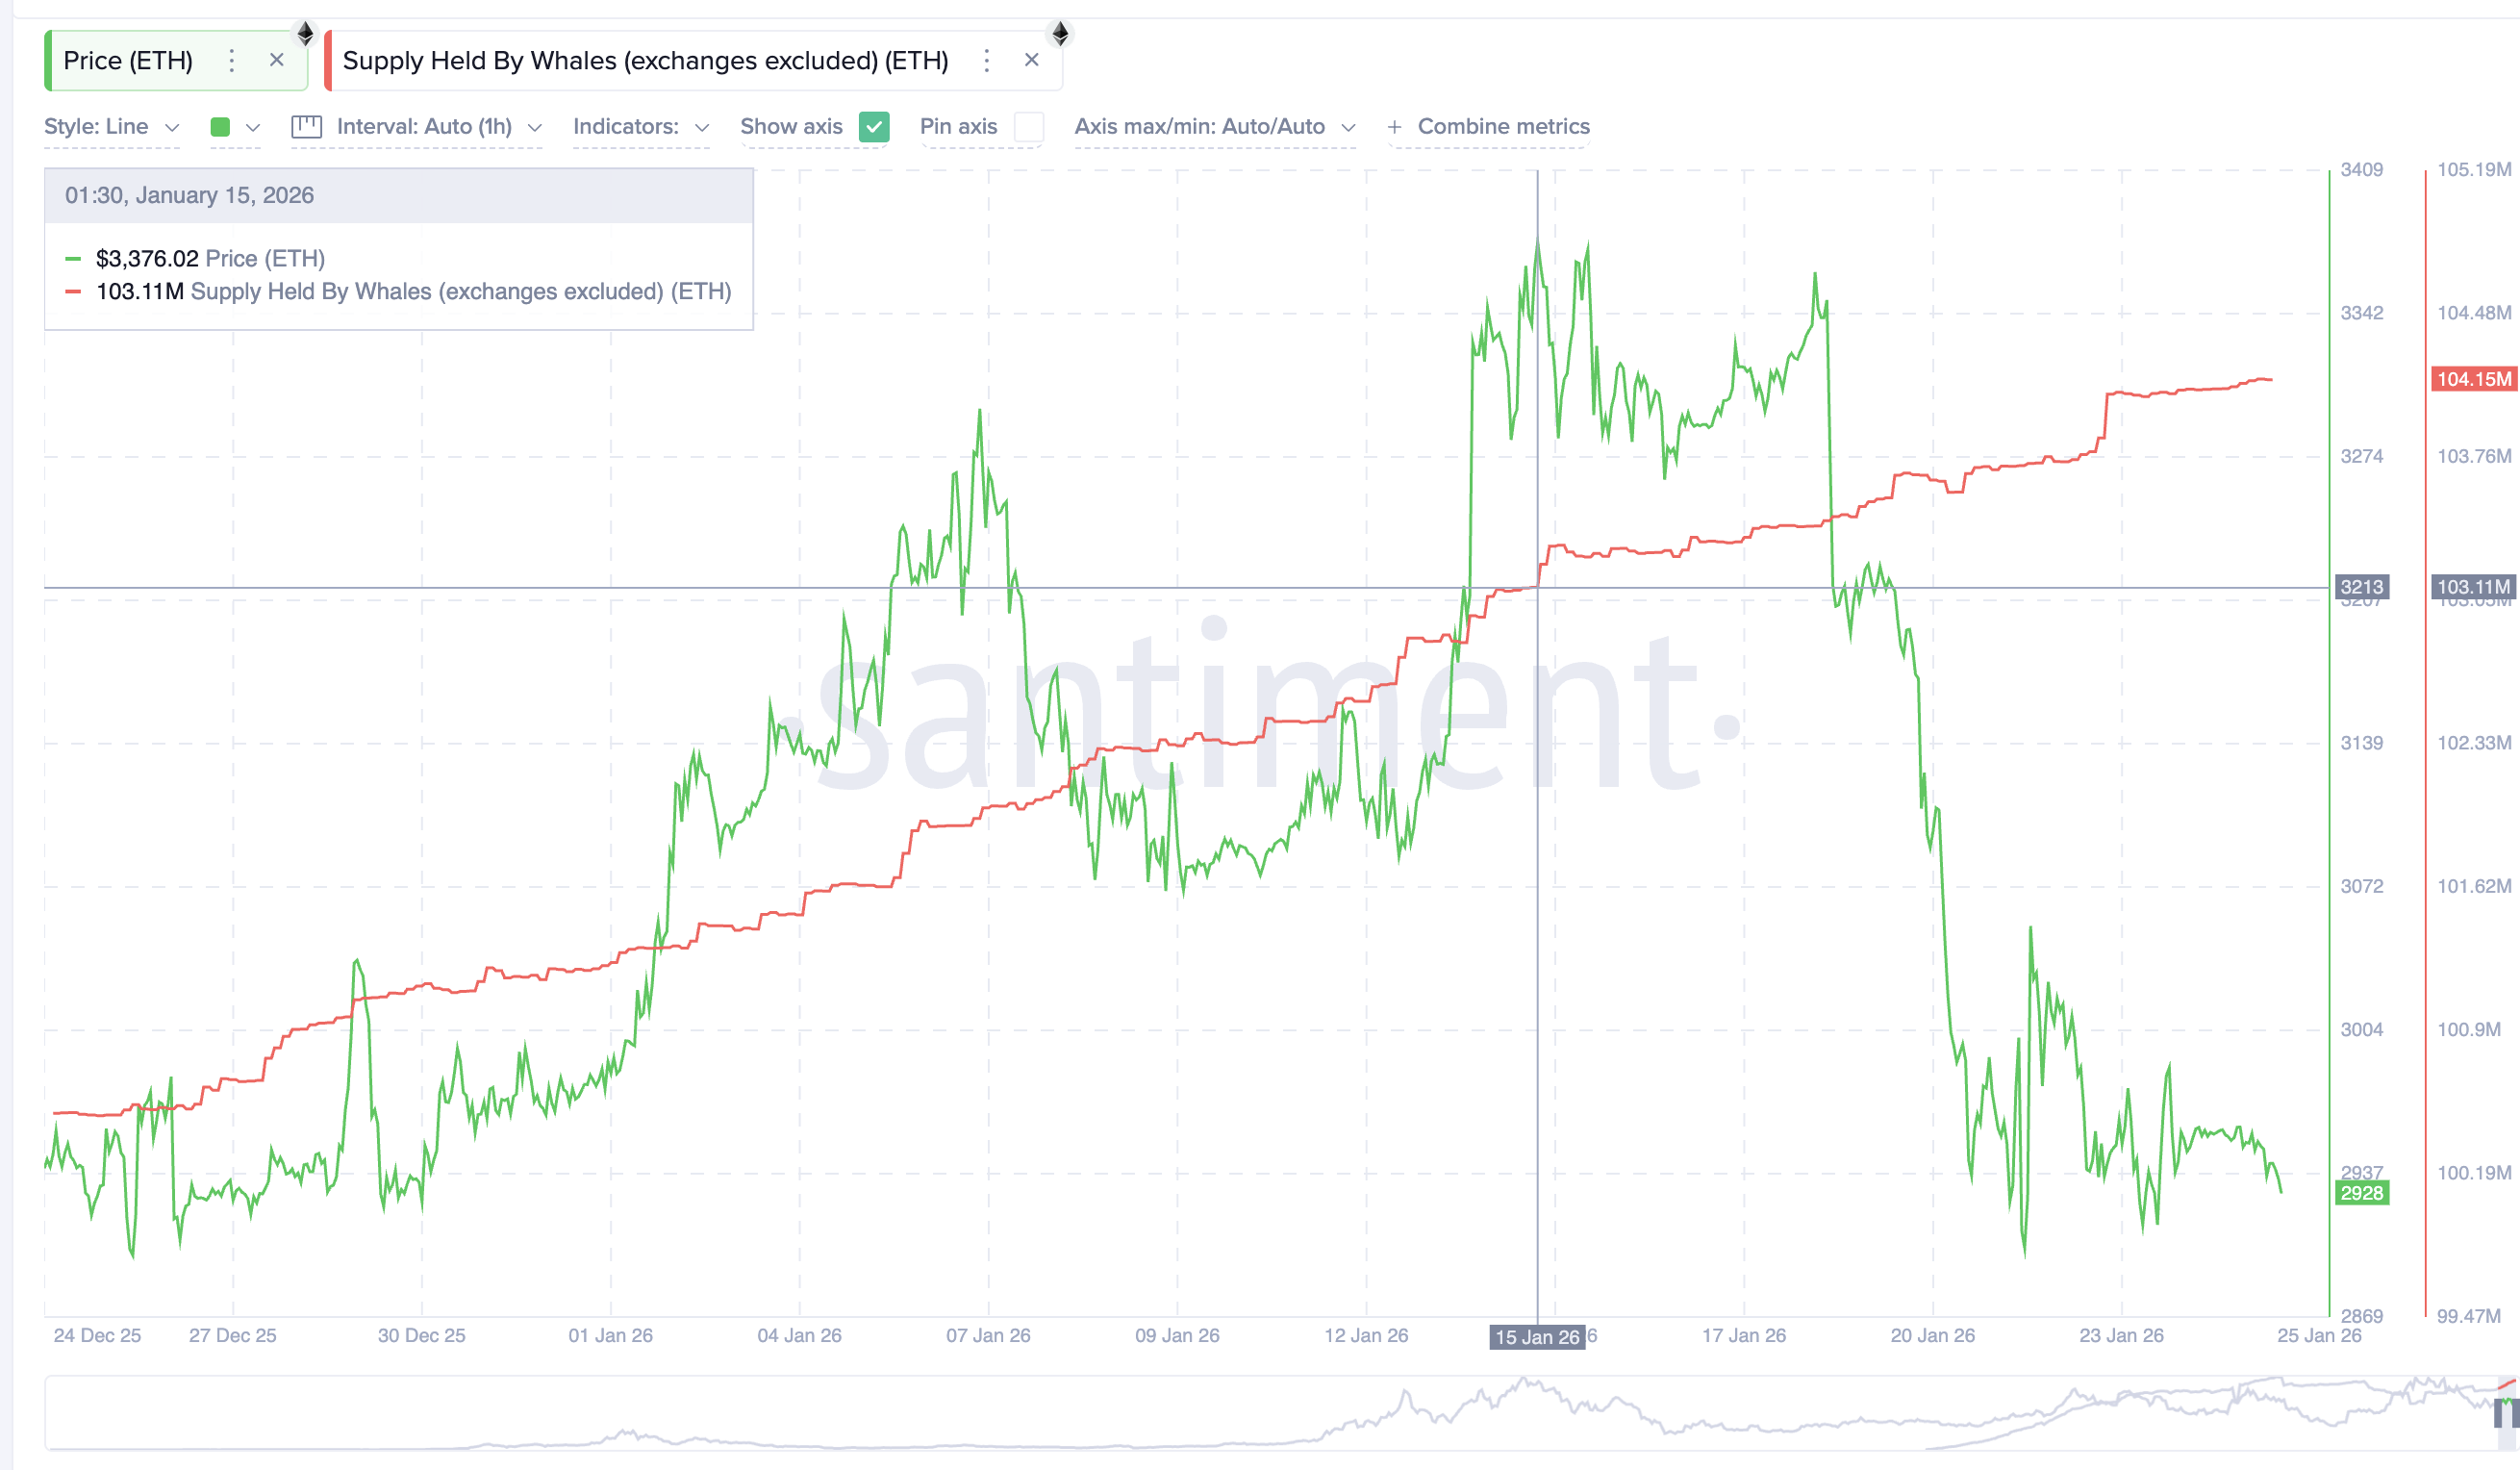
In isolation, whale accumulation looks supportive. But this time, it wasn’t enough.
The reason sits outside of on-chain behavior. ETF flows flipped hard. The week ending January 16 saw strong inflows, which helped fuel the breakout. The following week, ending January 23, recorded net ETF outflows of $611.17 million.
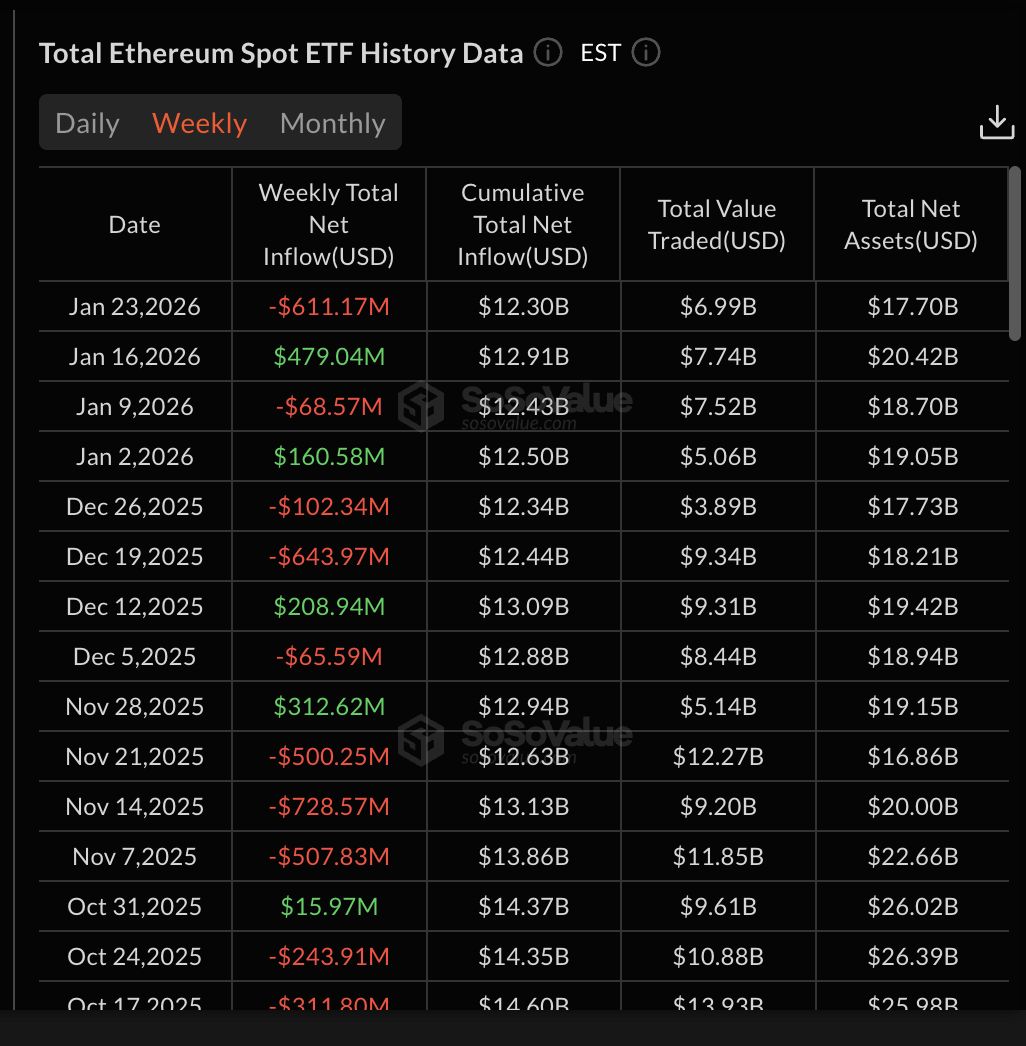
That shift mattered. ETF selling added steady, directional pressure just as Ethereum was testing a major supply wall. Whale buying met resistance here. Even large holders were effectively trapped above support as the Ethereum price slid lower.
This explains why the correction persisted despite accumulation. Demand existed, mostly from whales, but supply was heavier. The wall won. When ETF flows and cost-basis resistance align, price structure breaks down fast.
Ethereum Price Levels That Decide What Comes Next
Ethereum is now back inside the prior range, and the structure is weak.
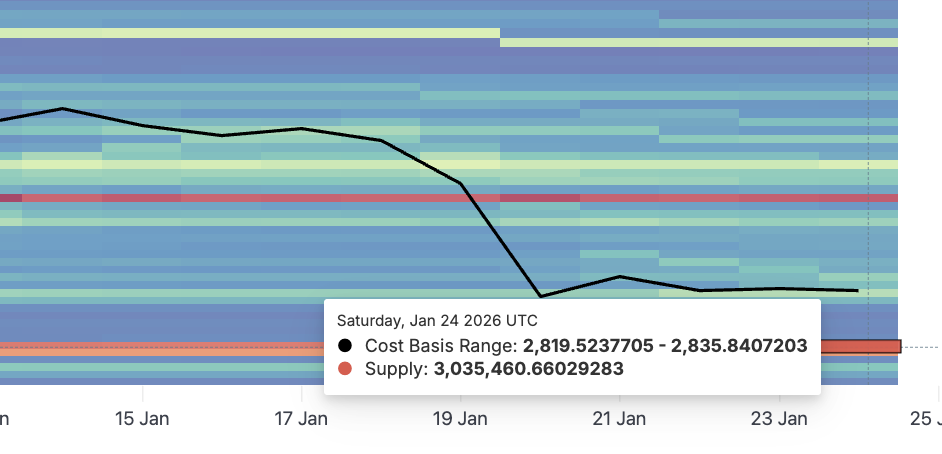
On the downside, $2,773 is the critical level, highlighted later on the Ethereum price chart.
A daily close below this zone would break the right shoulder of the inverse head-and-shoulders pattern and confirm the bull trap fully. That move would also threaten the $2,819 to $2,835 cost-basis cluster.
While this is a heavy-demand zone that can absorb selling pressure, losing it would expose Ethereum to accelerated downside.
Below that, the structure weakens quickly. On the upside, recovery must happen in steps.
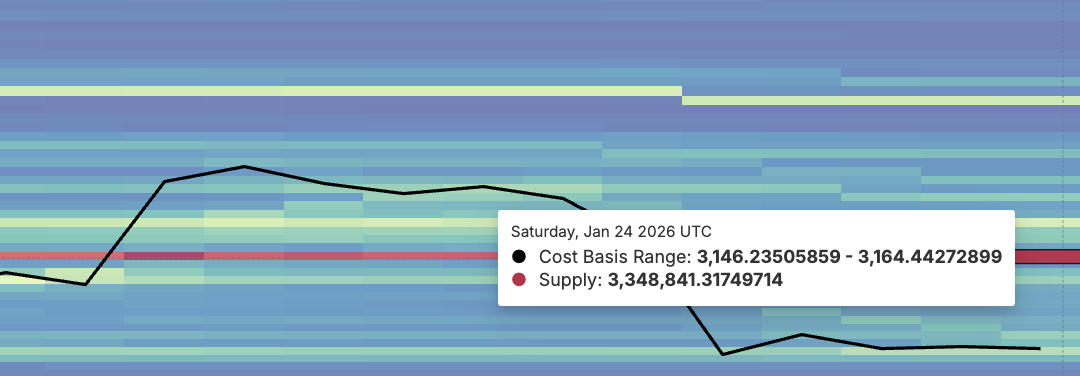
First, Ethereum needs to reclaim $3,046. That would stabilize the price, but it is not enough. The real test sits at $3,180, which flips the $3,146 to $3,164 supply wall. Clearing that zone would signal real demand returning.
Even then, resistance remains heavy. The larger sell wall around the $3,407- $3,487 zone still dominates the chart. That is the same zone that rejected the breakout and triggered the correction.
Until Ethereum clears those levels cleanly, rallies remain vulnerable. The takeaway is simple.
Ethereum did not fail because buyers were weak. It failed because the supply was overwhelming. Until that changes, the bull trap remains active.


