
Solana (SOL) Momentum Slows – Is $200 Still in Sight?
In Brief
- Solana leads all chains with $27.9 billion in weekly DEX volume, topping Ethereum and BNB Chain for the fourth straight week.
- Ecosystem strength grows as four Solana apps rank among the top 10 fee generators, led by Believe App with $3.68 million in daily fees.
- Technicals like RSI and Ichimoku suggest cooling momentum, with SOL entering a likely consolidation phase near key support.
Solana (SOL) is up 28.4% over the past month, but its momentum has slowed. After briefly touching $184, it has gained just 0.78% in the last seven days. Despite this, Solana continues to dominate DEX metrics, leading all chains with $27.9 billion in weekly volume.
The broader ecosystem remains active, with multiple Solana-based apps among the top fee generators. However, technical indicators such as RSI, Ichimoku Cloud, and EMA lines suggest the rally may be losing steam, signaling a potential period of consolidation or correction ahead.
Solana Leads DEX Market With $27.9 Billion Weekly Volume and Surging App Activity
Solana continues to assert its dominance in the decentralized exchange (DEX) ecosystem, leading all chains in trading volume for the fourth consecutive week.
Over the past seven days alone, Solana recorded $27.9 billion in DEX volume—surpassing BNB Chain, Ethereum, Base, and Arbitrum.
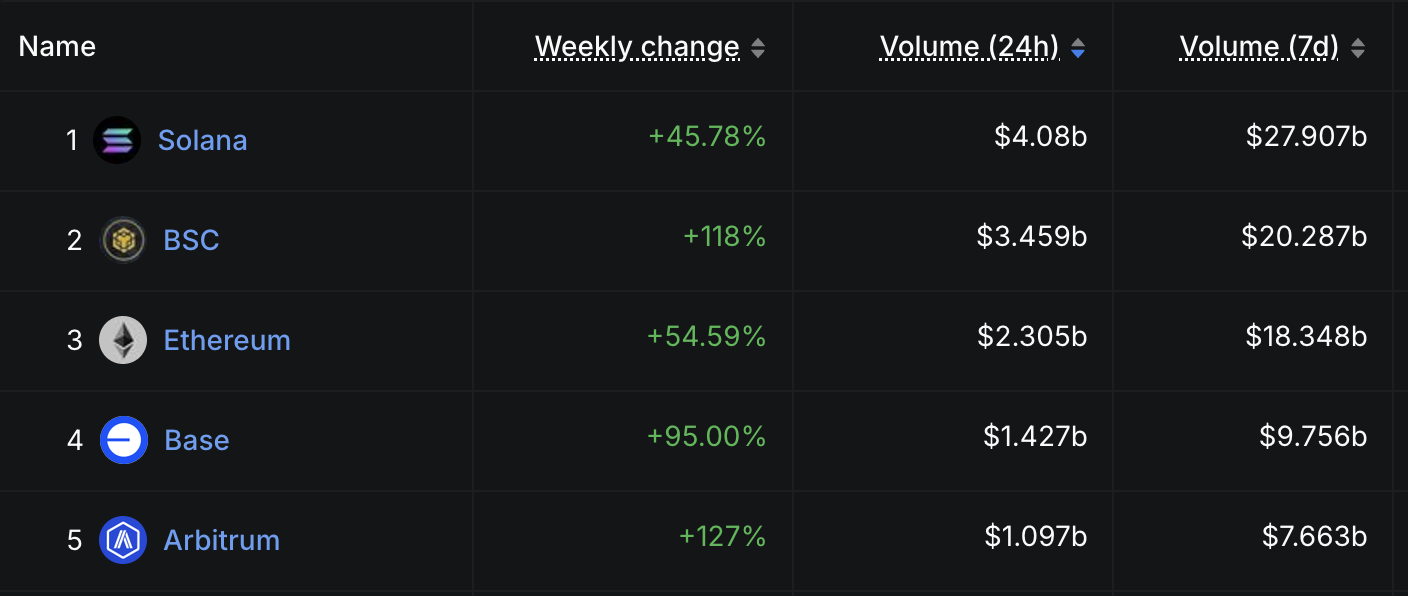
The weekly DEX volume for Solana surged by 45.78%, signaling a strong resurgence in on-chain activity after decreasing activity between March and April.
This rise is a spike and part of a broader trend, with volumes consistently staying above the $20 billion mark over the past month.
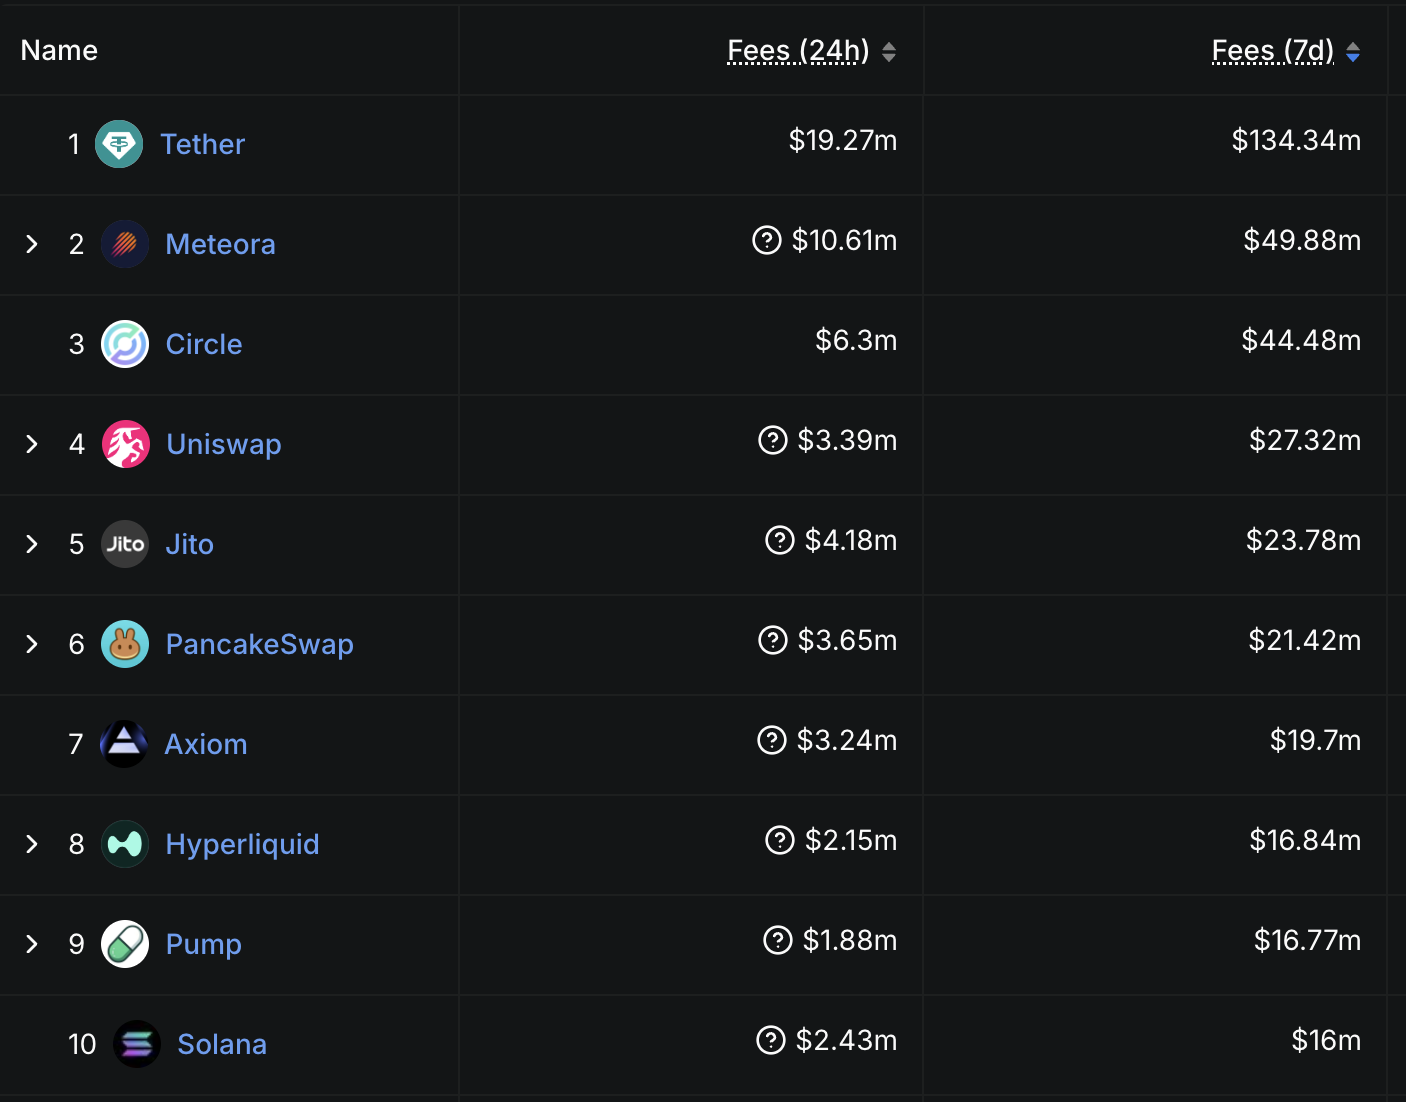
Adding to its momentum, Solana is home to four of the past week’s ten highest fee-generating apps and chains. This includes familiar platforms and newcomers, showing a healthy diversity in the ecosystem.
Believe App, a newly launched Solana-based launchpad, stands out in the recent surge. In the last 24 hours alone, it generated $3.68 million in fees—surpassing well-established platforms like PancakeSwap, Uniswap, and Tron.
Get to know Godleak
Godleak crypto signal is a service which provide profitable crypto and forex signals for trading. Godleak tried to provide you signals of best crypto vip channels in the world.
It means that you don’t need to buy individual crypto signal vip channels that have expensive prices. We bought all for you and provide you the signals with bot on telegram without even a second of delay.

Godleak crypto leak service have multiple advantages in comparision with other services:
- Providing signal of +160 best crypto vip channels in the world
- Using high tech bot to forward signals
- Without even a second of delay
- Joining in +160 separated channels on telegram
- 1 month, 3 months , 6 months and yearly plans
- Also we have trial to test our services before you pay for anything
For joining Godleak and get more information about us only need to follow godleak bot on telegram and can have access to our free vip channels. click on link bellow and press start button to see all features
Join for Free
☟☟☟☟☟
https://t.me/Godleakbot
Also you can check the list of available vip signal channels in the bot. by pressing Channels button.
Momentum Cools for SOL as Indicators Turn Neutral
Solana’s Relative Strength Index (RSI) has dropped to 51.99, down from 66.5 just three days ago, signaling a clear loss of bullish momentum.
Over the past few days, the RSI has hovered between 44 and 50, reflecting a more neutral market sentiment after previously nearing overbought conditions.
This shift suggests that traders are more cautious, and recent gains may be cooling off.
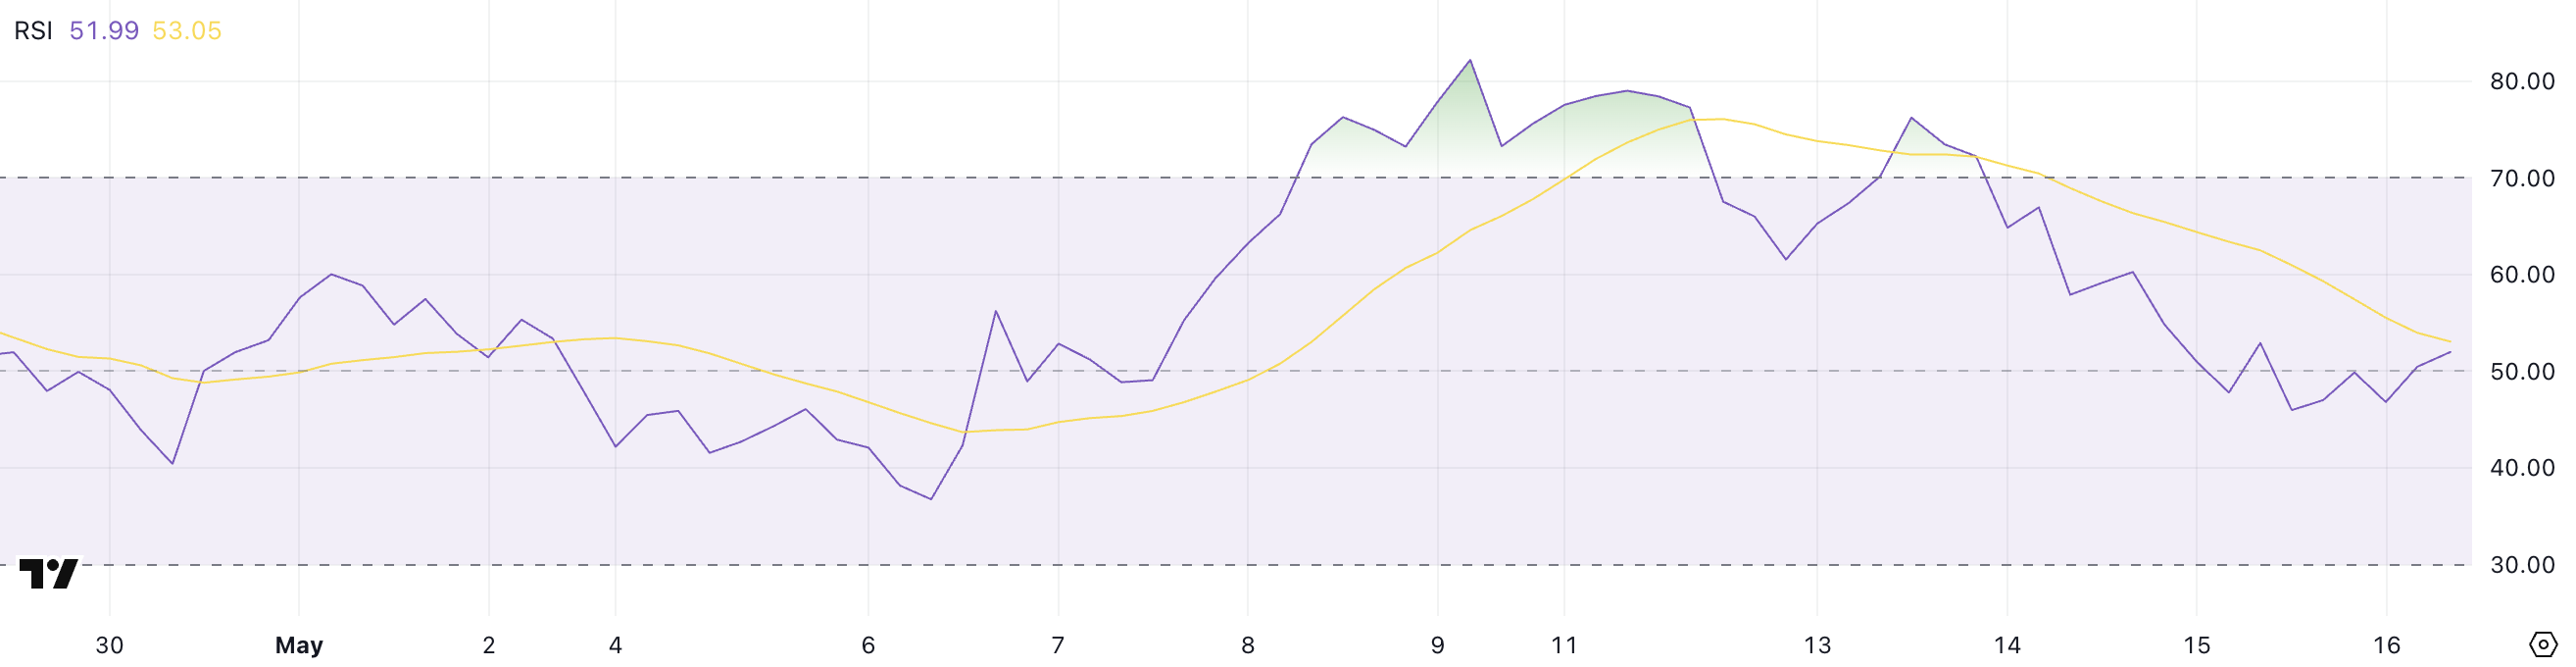
The RSI is a momentum indicator that ranges from 0 to 100, with values above 70 indicating overbought conditions and below 30 signaling oversold territory. At 51.99, Solana sits in the neutral zone, which typically suggests a period of consolidation or indecision.
If the RSI rises above 60 again, it could point to renewed bullish strength; if it dips below 45, further downside pressure may follow.
Solana’s Ichimoku Cloud chart shows a period of consolidation following a strong uptrend, with key signals now suggesting indecision.
The price is hovering near the Kijun-sen (red line) and Tenkan-sen (blue line), both of which have started to flatten—indicating a slowdown in momentum.
The Chikou Span (green lagging line) remains above the candles, suggesting that the broader trend still has a bullish bias. However, the lack of distance between it and the current price action reflects weakening strength.
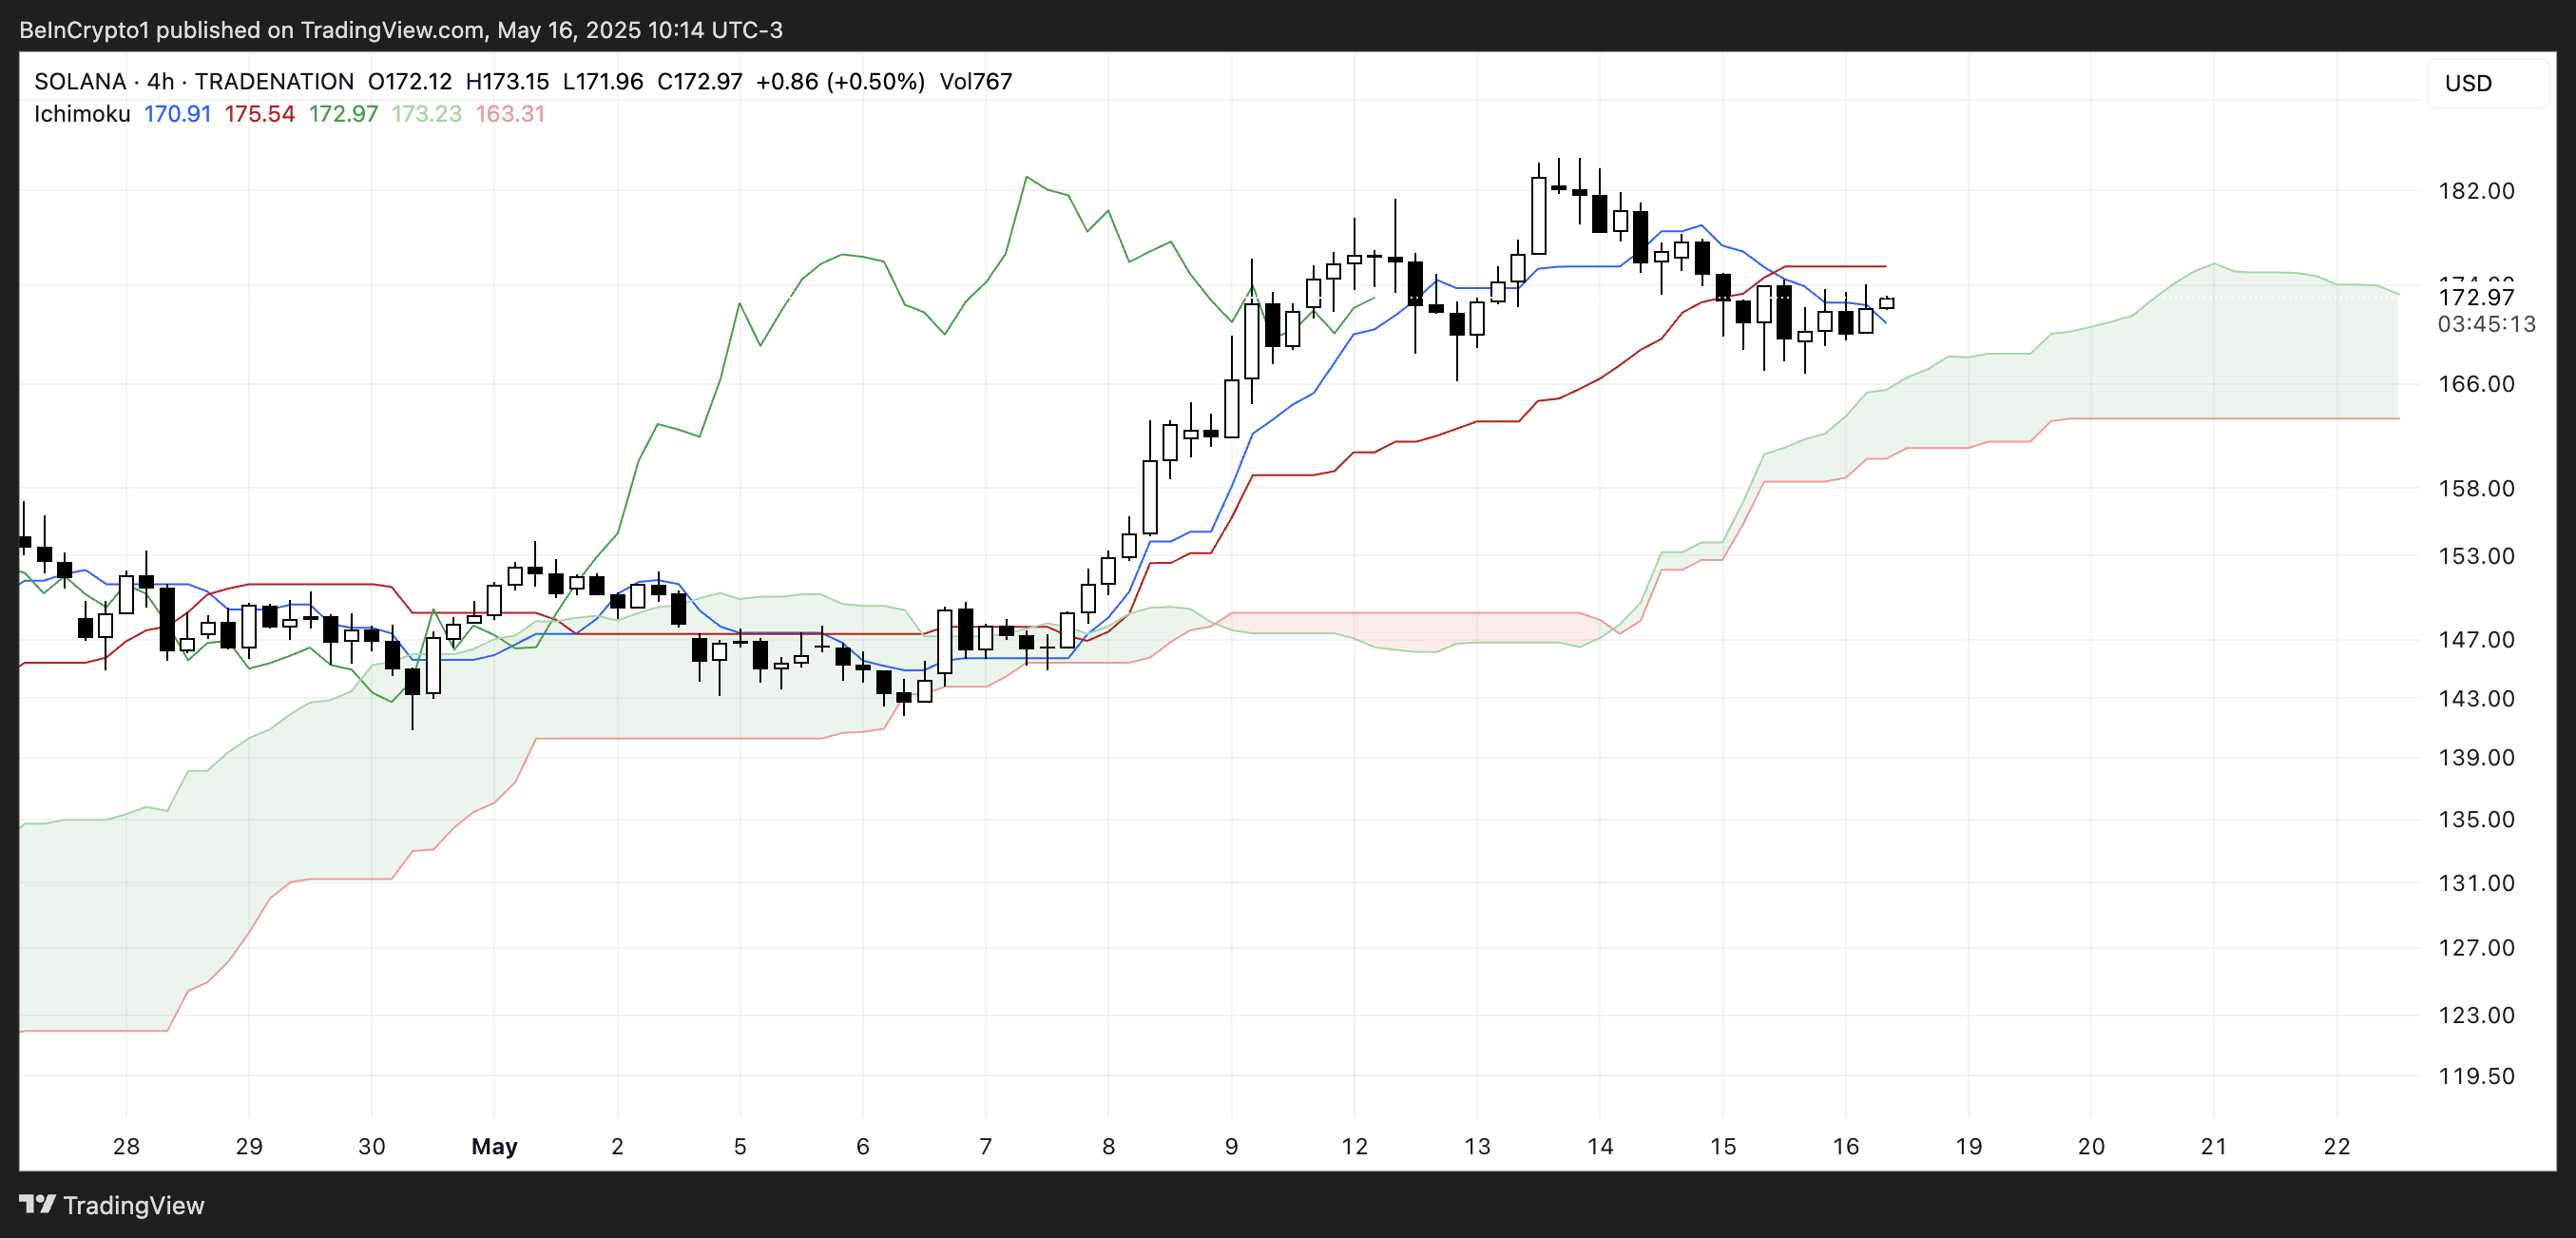
The Kumo Cloud (green and red shaded area) ahead is still bullish, with the leading span lines spread apart, providing support beneath the current price.
However, with candles now closely interacting with the Kijun-sen and failing to strongly break above the Tenkan-sen, the short-term sentiment appears cautious.
If the price can push decisively above the blue line, momentum may return, but any drift into the cloud could signal the start of a more prolonged consolidation phase or potential trend reversal.
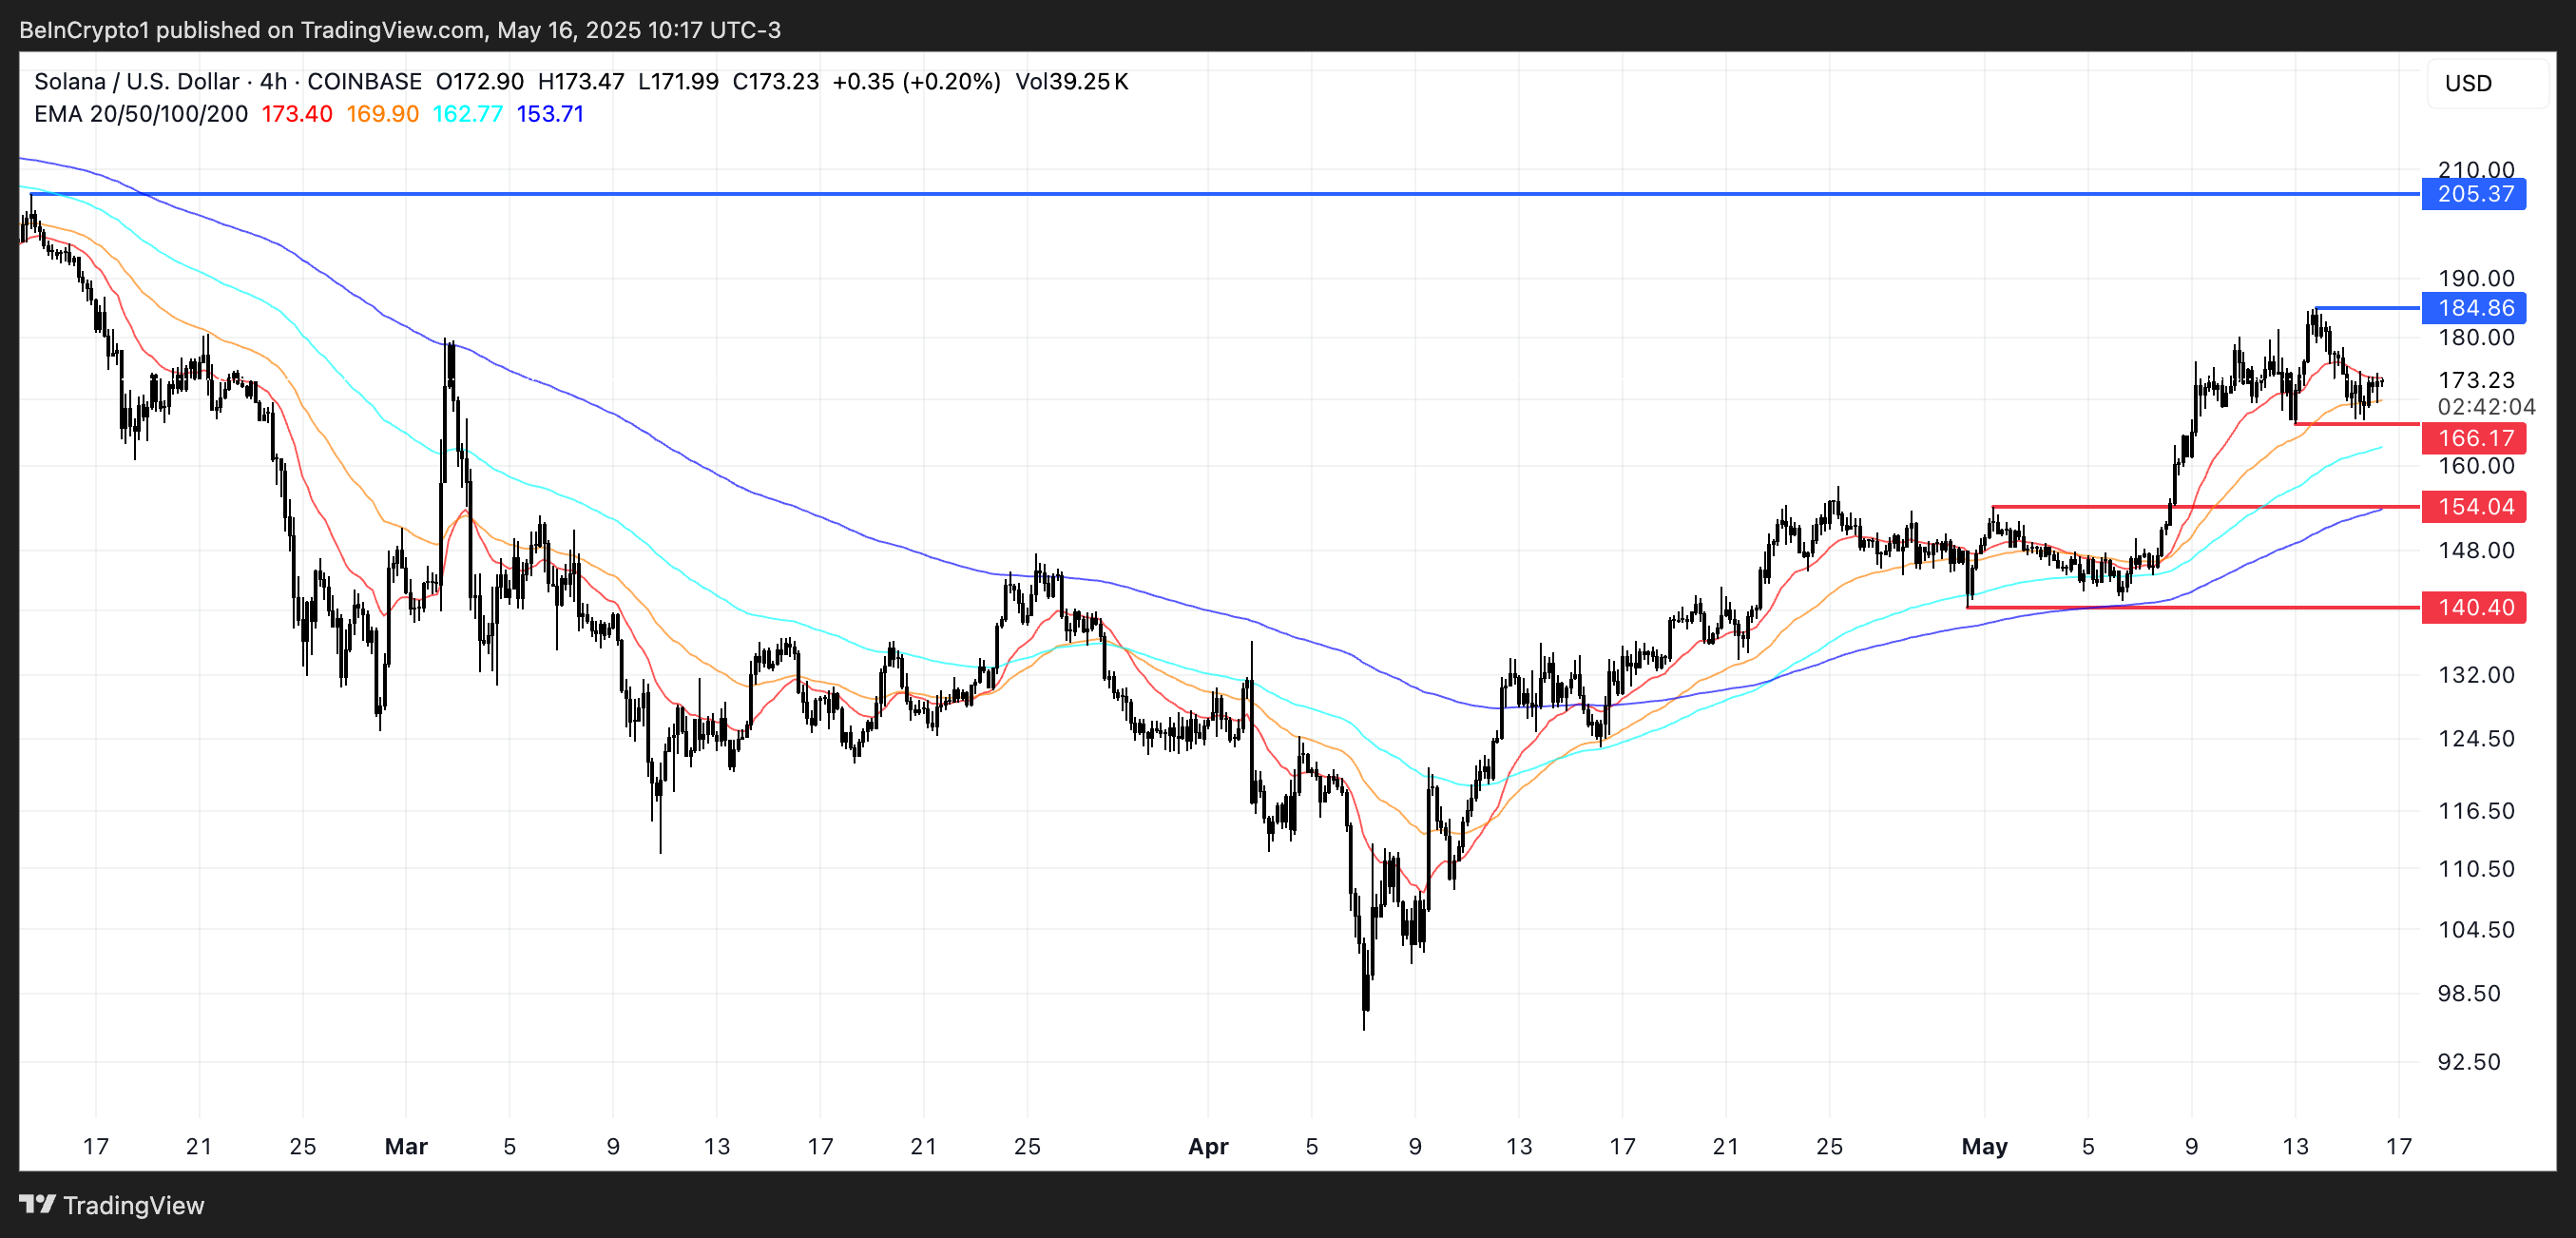
Solana’s Bullish EMA Structure Faces Momentum Slowdown
Solana’s EMA lines remain bullish, with the short-term moving averages positioned above the longer-term ones. However, the gap between these lines is narrowing, suggesting that upward momentum is weakening.
Solana price recently failed to break past a key resistance level, and although a retest could open the path toward reclaiming the $200 zone, the lack of strong follow-through raises questions about the trend’s strength.
Complementing this cautious outlook, the Ichimoku Cloud and RSI indicators point to a potential cooldown. Solana recently held above an important support level but remains vulnerable—if that support breaks, further downside could follow.
The broader structure still leans bullish, but the market appears to be at a crossroads. The next move likely depends on whether buyers can reclaim initiative or sellers push through key lower levels.


