
AAVE Price Nears 3-Year Highs Amid Bullish Sentiment

In Brief
- AAVE price has surged 220% this year and 110% in the last 30 days, driven by strong bullish momentum.
- RSI at 59.2 indicates neutral-to-bullish momentum, signaling potential consolidation after a recent near-overbought peak.
- CMF remains positive at 0.17, suggesting sustained capital inflows but hints at cooling momentum following a peak of 0.27.
AAVE price continues to surge, cementing its position as the biggest lending protocol in crypto with a market cap of $5.5 billion—more than all other top 10 lending protocols combined.
The token has risen an impressive 220% this year and 110% in just the last 30 days, driven by strong bullish momentum and increasing market interest. Technical indicators such as the RSI and CMF highlight ongoing positive trends, though some signs of cooling momentum suggest potential consolidation ahead.
AAVE RSI Is Neutral After Almost Reaching the Overbought Zone
AAVE Relative Strength Index (RSI) is currently at 59.2, down from 69.19 on December 23, when its price peaked at $382. This decline in RSI suggests that AAVE price has moved away from overbought territory, where heightened buying pressure typically precedes a price correction.
While the current RSI still reflects relatively strong momentum, the pullback indicates that the market may be stabilizing after a period of intense buying activity.
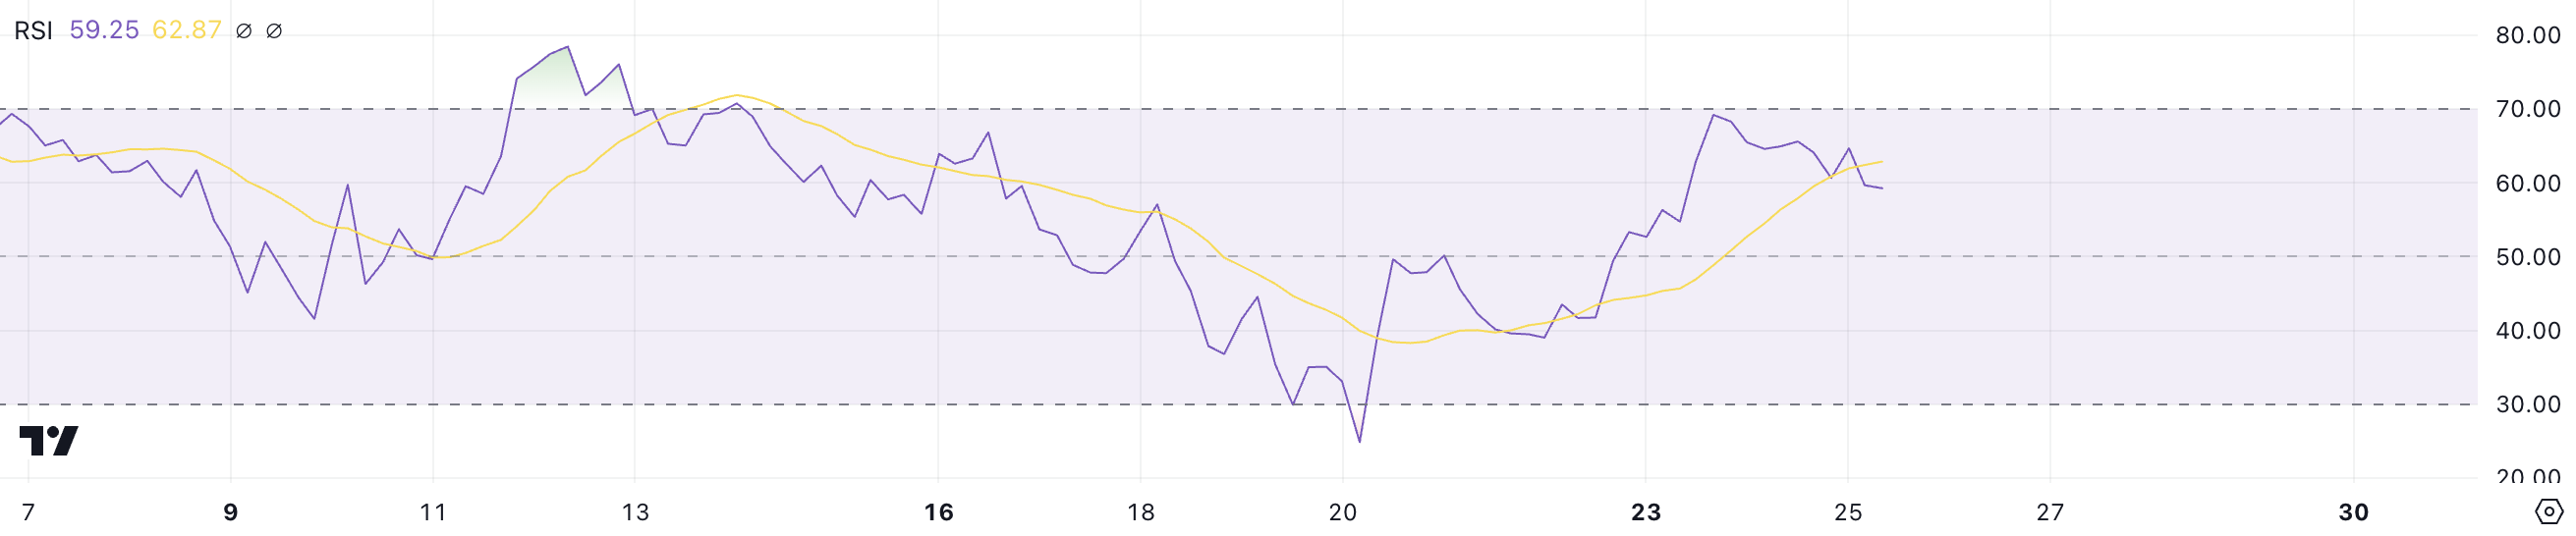
RSI is a momentum indicator that measures the speed and magnitude of price movements on a scale from 0 to 100. Values above 70 indicate overbought conditions, signaling the potential for a correction, while values below 30 suggest oversold conditions, often preceding a rebound.
With AAVE RSI at 59.2, the coin remains in a neutral-to-bullish range, signaling that the uptrend could continue in the short term if buying momentum rebuilds. However, the decline from overbought levels also suggests that AAVE price may consolidate, allowing the market to absorb recent gains before deciding its next direction.
Get to know Godleak
Godleak crypto signal is a service which provide profitable crypto and forex signals for trading. Godleak tried to provide you signals of best crypto vip channels in the world.
It means that you don’t need to buy individual crypto signal vip channels that have expensive prices. We bought all for you and provide you the signals with bot on telegram without even a second of delay.

Godleak crypto leak service have multiple advantages in comparision with other services:
- Providing signal of +160 best crypto vip channels in the world
- Using high tech bot to forward signals
- Without even a second of delay
- Joining in +160 separated channels on telegram
- 1 month, 3 months , 6 months and yearly plans
- Also we have trial to test our services before you pay for anything
For joining Godleak and get more information about us only need to follow godleak bot on telegram and can have access to our free vip channels. click on link bellow and press start button to see all features
Join for Free
☟☟☟☟☟
https://t.me/Godleakbot
Also you can check the list of available vip signal channels in the bot. by pressing Channels button.
 
AAVE CMF Is Still Very Positive, But Down From The Recent Peak
AAVE’s Chaikin Money Flow (CMF) is currently at 0.17, maintaining a positive trend since December 23, when it reached a peak of 0.27. This indicates that AAVE has been experiencing consistent capital inflows, reflecting strong buying pressure in the market.
While the CMF has declined from its recent peak, the positive value suggests that buyers are still in control, albeit with slightly reduced intensity.
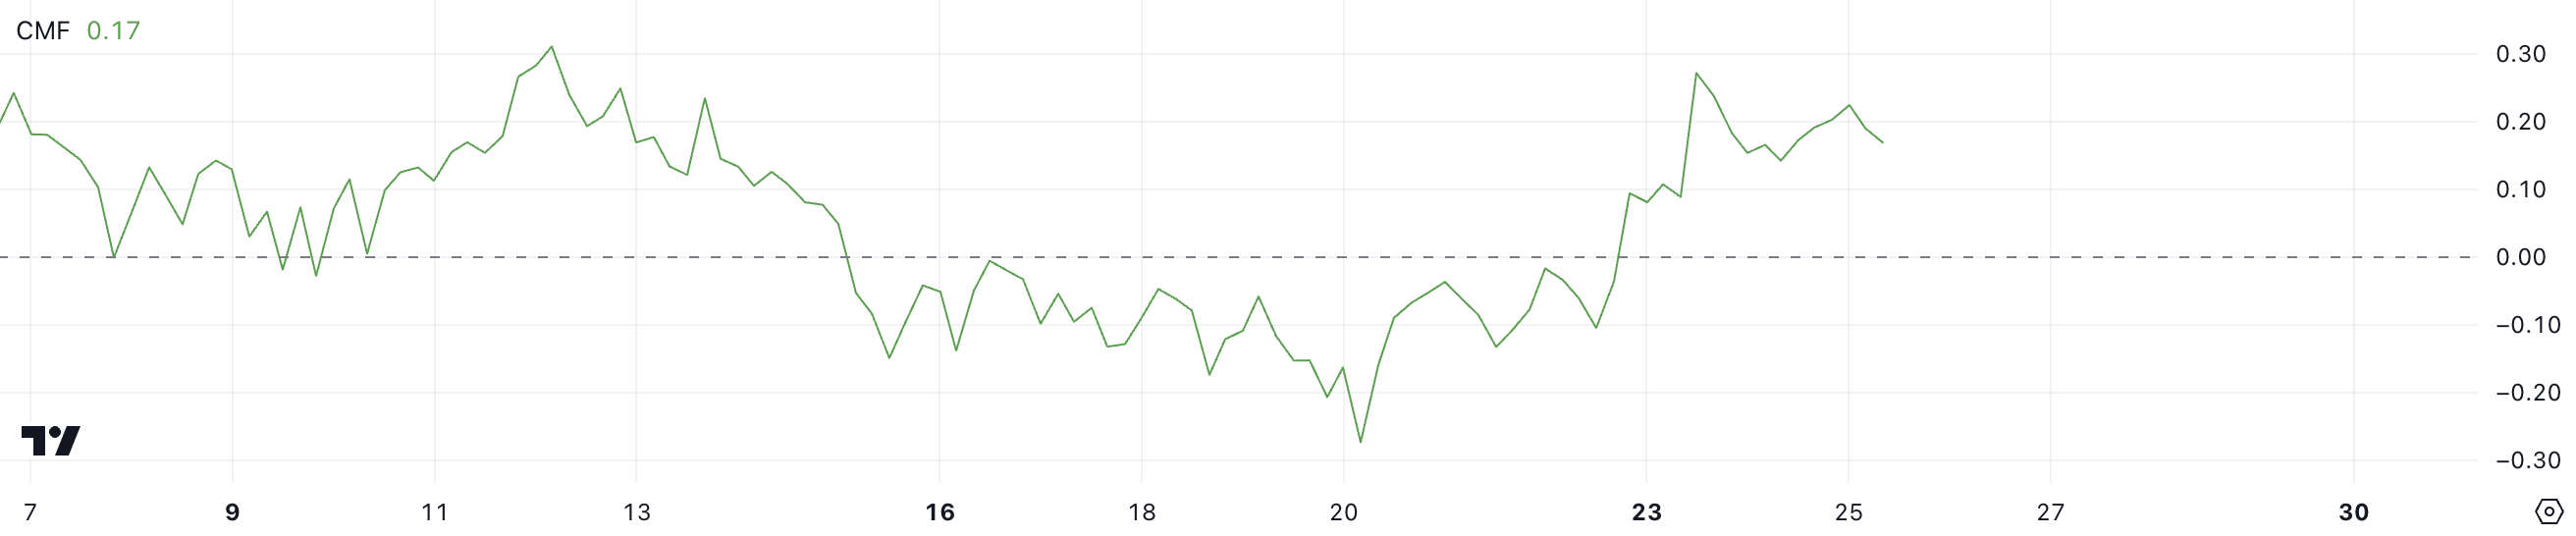
CMF is a volume-weighted indicator that measures the accumulation or distribution of an asset over a specific period, ranging from -1 to +1. Positive CMF values indicate accumulation and buying pressure, while negative values signify distribution and selling pressure.
With AAVE CMF at 0.17, the ongoing positive inflow suggests that the token may sustain its current price levels or even see further gains in the short term if buying activity persists. However, the decline from the December 23 peak indicates that momentum may be cooling, potentially leading to a period of consolidation before any decisive move.
AAVE Price Prediction: Can AAVE Rise to 3-Year Highs?
If the current positive momentum continues, AAVE price could test $400, a significant level that would mark its highest price since 2021. The token needs to rise just 7.5% to reach this milestone, supported by the golden cross formation on December 23 and EMA lines that indicate the uptrend could persist.
This alignment of technical indicators suggests that bullish sentiment remains strong, with buyers likely to push prices higher if the trend holds steady.
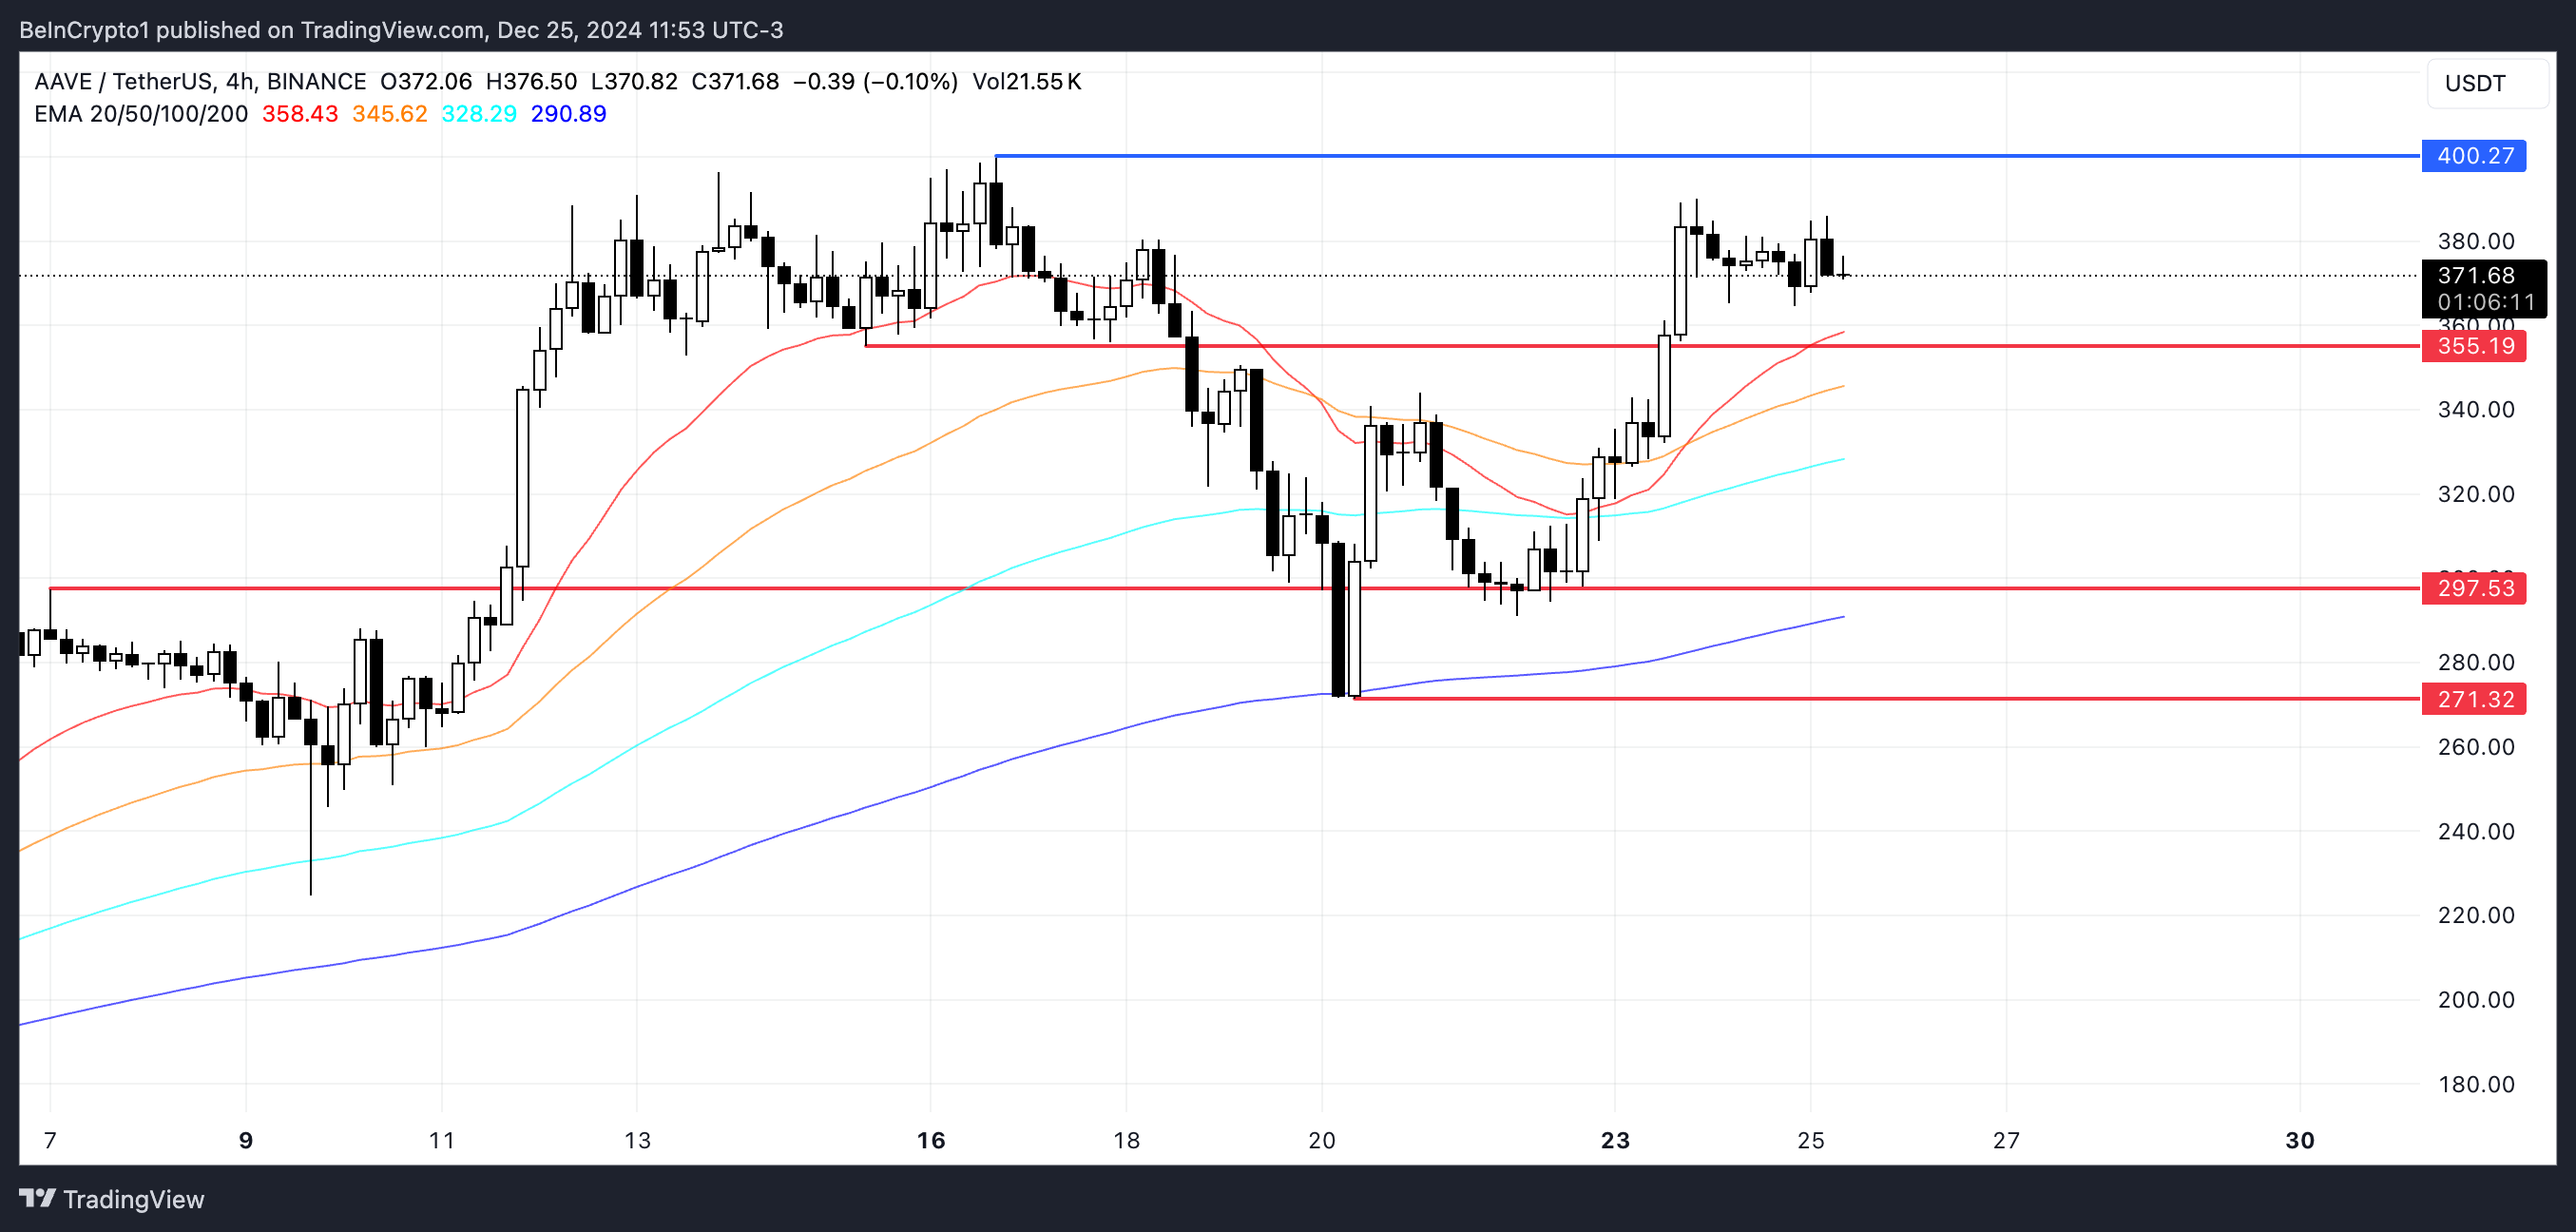
However, as highlighted by the CMF, the strength of the uptrend has waned compared to a few days ago, signaling the potential for a trend reversal. If AAVE price uptrend loses steam, the price could drop to test the $355 support level.
Should this support fail, AAVE might see further declines, with potential targets at $297 or even $271, reflecting a significant correction.


