
BNB Faces Short-Term Bearish Pressure Despite Ecosystem Growth

In Brief
- BNB faces bearish pressure despite rising ecosystem interest, down 3% over the past week.
- DMI shows weak trend strength and growing selling pressure, signaling market indecision.
- Bearish Ichimoku Cloud setup suggests downside risks, with key support at $629.
BNB has been in the spotlight in the last few weeks, with rising trading volume and growing interest in its ecosystem, including meme coins like TST. Despite the hype, BNB’s price is down more than 3% in the last seven days, reflecting continued market uncertainty.
Its DMI shows weak trend strength and growing selling pressure, while the Ichimoku Cloud indicates a bearish setup. With EMA lines showing no clear direction, BNB faces a critical moment as it could either regain momentum or drop below $600 if the downtrend continues.
BNB DMI Shows Buyers Tried to Gain Control, But Sellers Are Rising Again
BNB’s DMI chart shows its ADX at 14, reflecting weak trend strength after touching a low of 11.1 yesterday and briefly rising to nearly 16 a few hours ago.
ADX, or the Average Directional Index, measures the strength of a trend without indicating its direction. It ranges from 0 to 100, with values above 25 indicating a strong trend and values below 20 suggesting a weak or undefined trend.
With ADX at 14, BNB is currently in a low-momentum phase, indicating that the market lacks a clear directional trend.
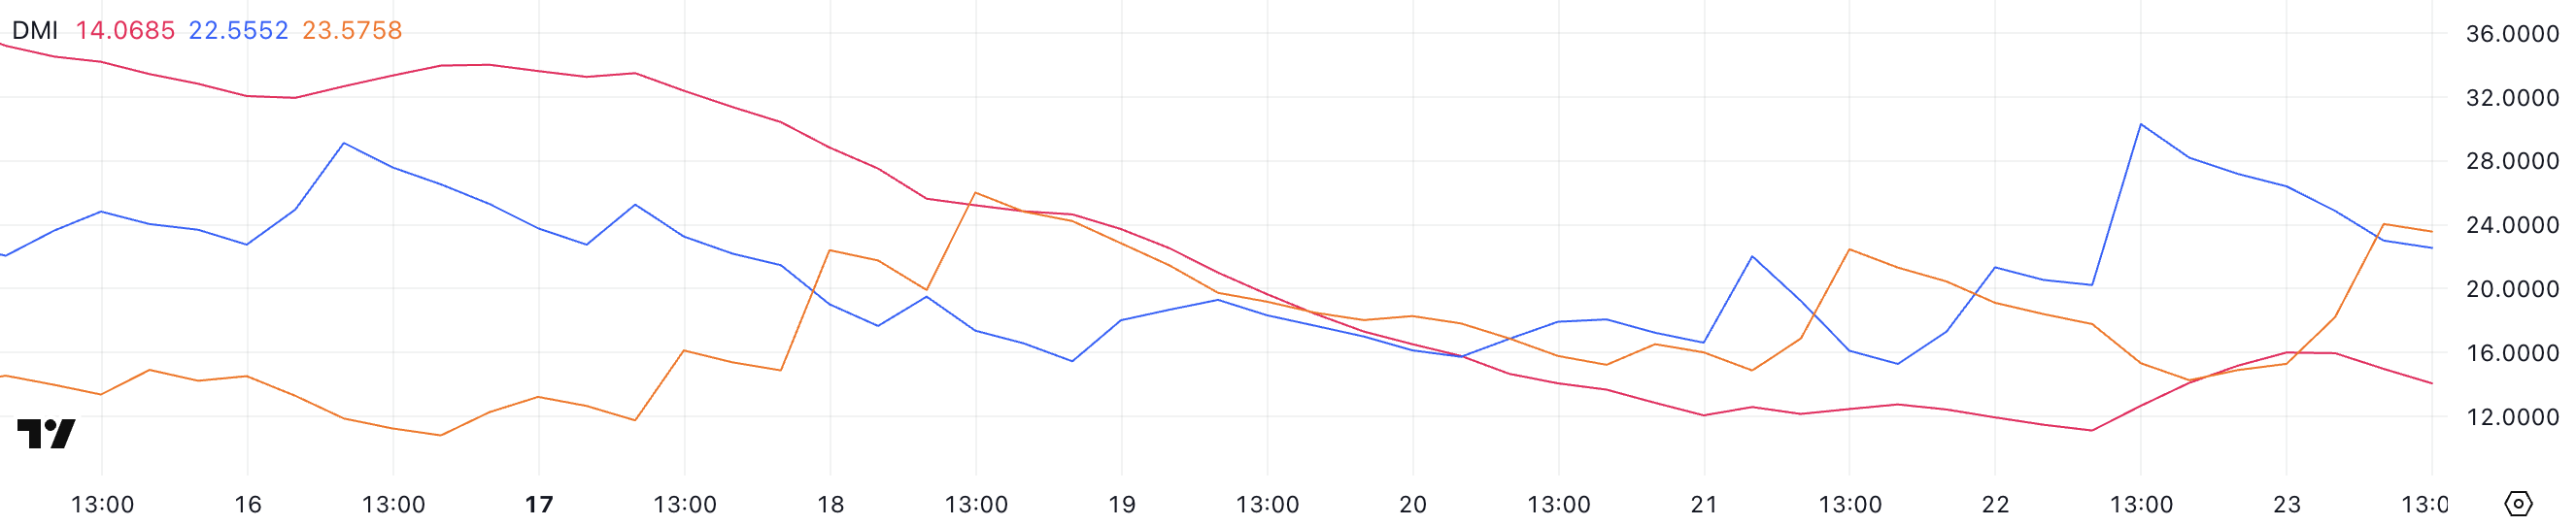
+DI is at 22.5, up from 15.2 yesterday but down from 30.3 a few hours ago, suggesting that buying pressure increased but then weakened. Meanwhile, -DI is at 23.5, rising from 14.2 one day ago, indicating growing selling pressure.
The proximity of +DI and -DI shows a tug-of-war between buyers and sellers, reflecting market indecision. With ADX low and +DI and -DI close to each other, BNB price is likely to remain range-bound until a stronger trend emerges.
If +DI crosses above -DI, it could signal a bullish reversal, while -DI maintaining dominance could lead to further downside.
Ichimoku Cloud Shows a Bearish Setup
The Ichimoku Cloud for BNB shows a bearish outlook. The price is currently trading below the cloud, indicating downward momentum. The red cloud ahead suggests resistance, making it challenging for BNB to break above current levels.
The Tenkan-sen (blue line) is below the Kijun-sen (orange line), confirming a bearish crossover, which typically signals continued selling pressure.
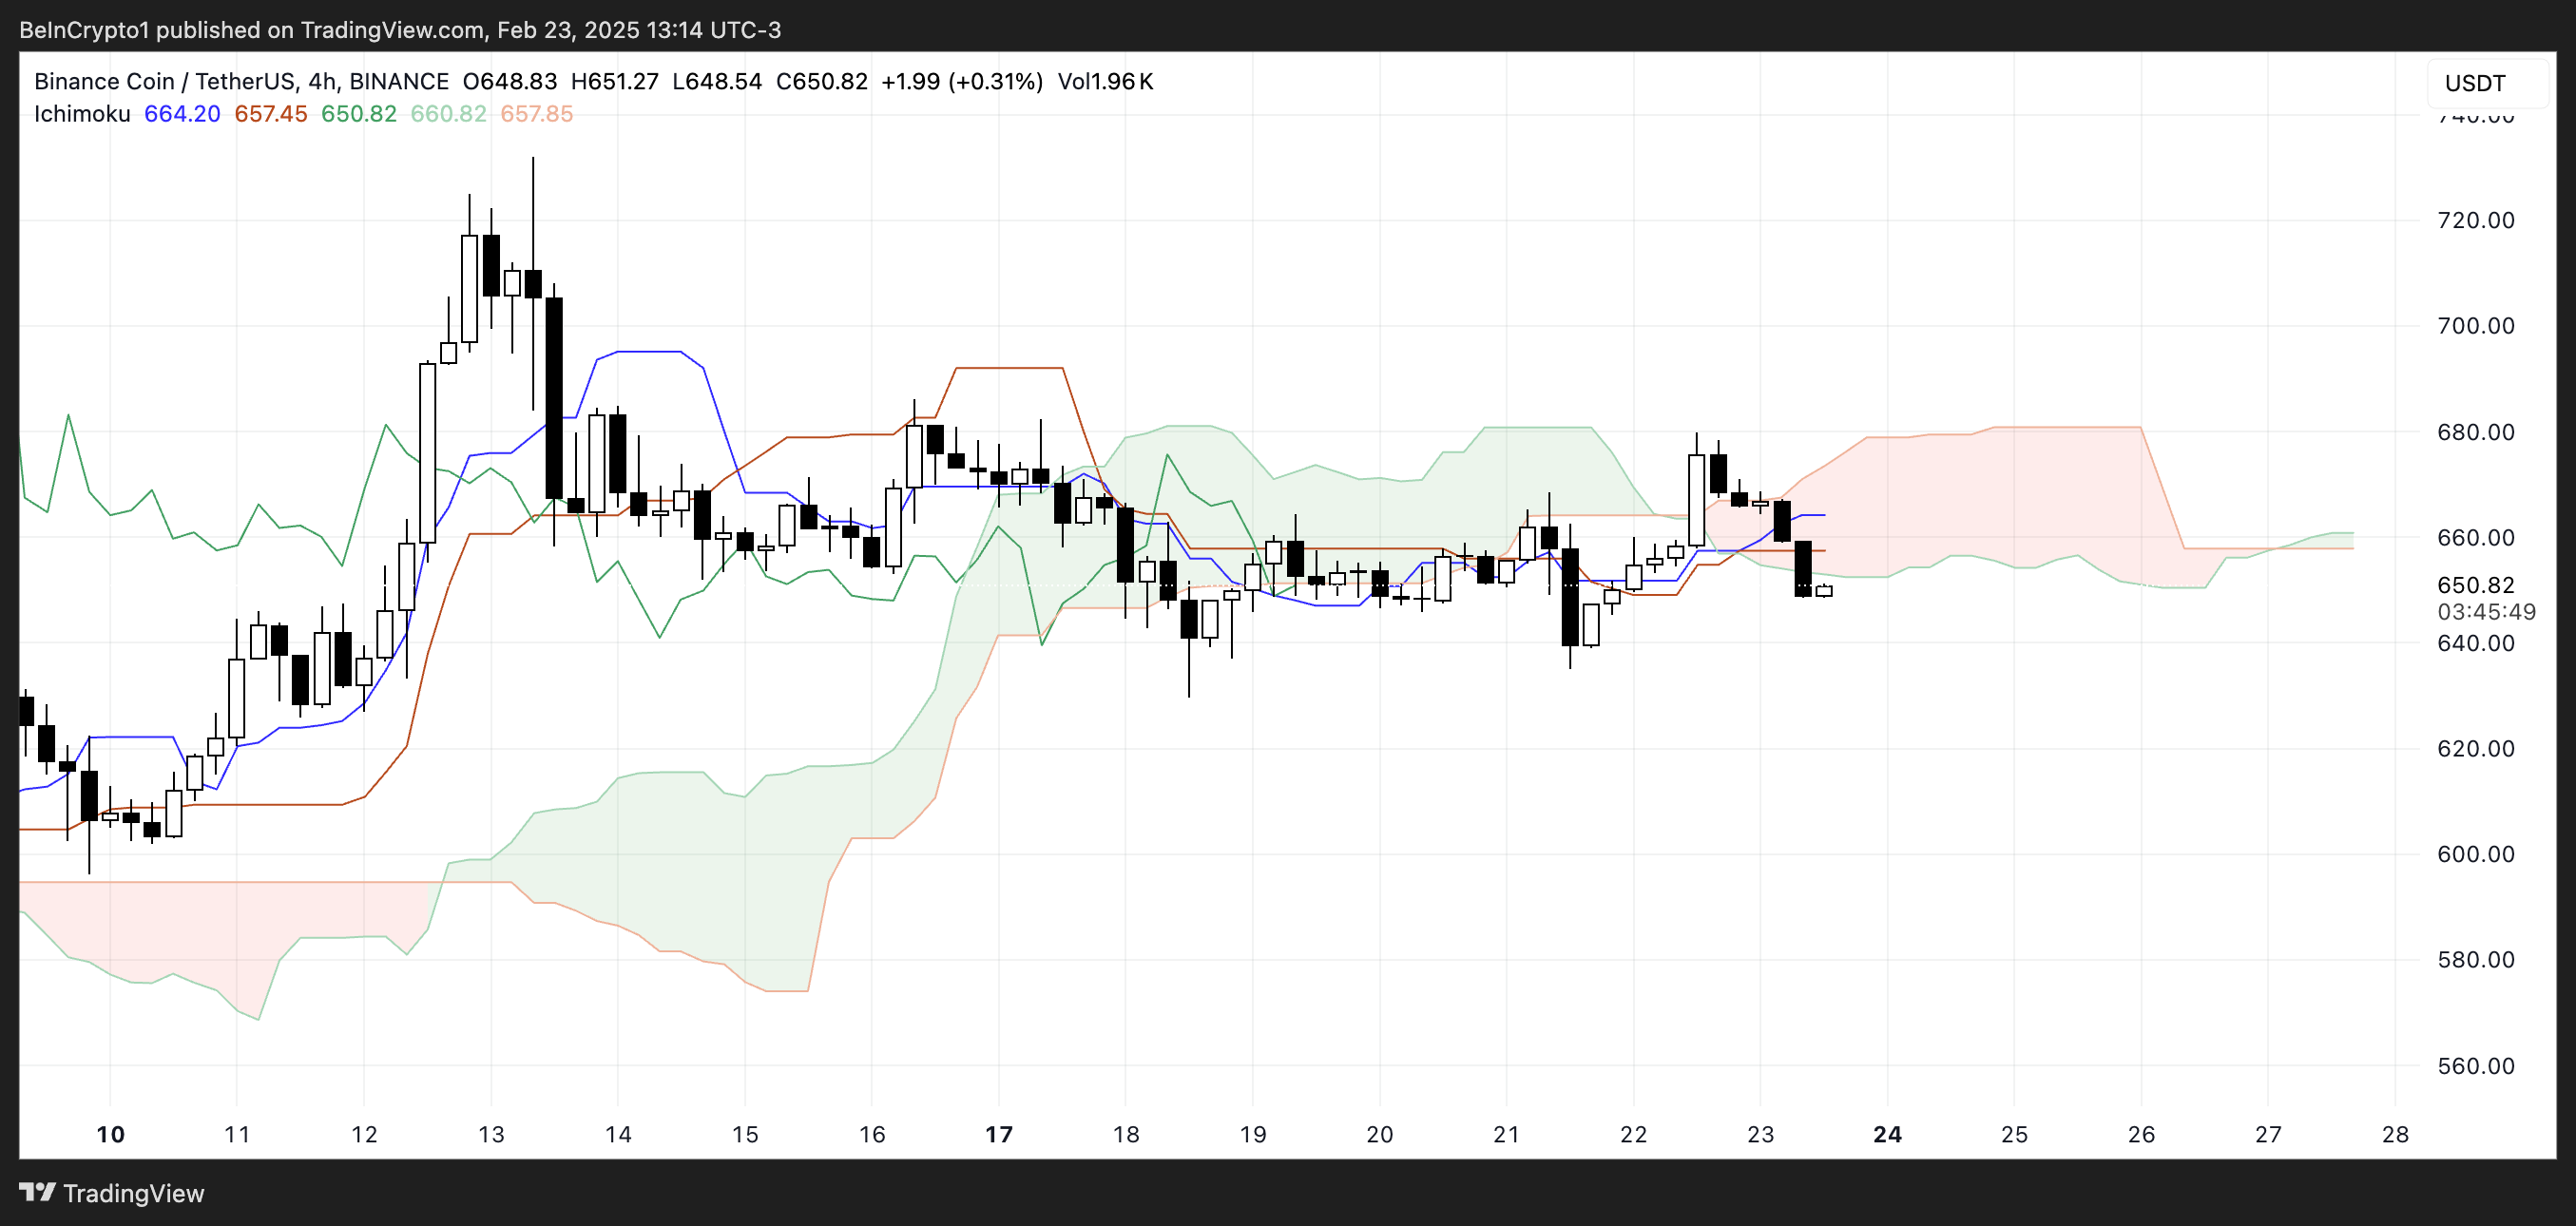
Additionally, the Chikou Span (green line) is below the price action, supporting the bearish sentiment. If this downtrend continues, BNB could test lower support levels.
However, a breakout above the red cloud would be needed to shift to a bullish outlook. For now, the bearish structure remains intact, suggesting further downside risks.
Get to know Godleak
Godleak crypto signal is a service which provide profitable crypto and forex signals for trading. Godleak tried to provide you signals of best crypto vip channels in the world.
It means that you don’t need to buy individual crypto signal vip channels that have expensive prices. We bought all for you and provide you the signals with bot on telegram without even a second of delay.

Godleak crypto leak service have multiple advantages in comparision with other services:
- Providing signal of +160 best crypto vip channels in the world
- Using high tech bot to forward signals
- Without even a second of delay
- Joining in +160 separated channels on telegram
- 1 month, 3 months , 6 months and yearly plans
- Also we have trial to test our services before you pay for anything
For joining Godleak and get more information about us only need to follow godleak bot on telegram and can have access to our free vip channels. click on link bellow and press start button to see all features
Join for Free
☟☟☟☟☟
https://t.me/Godleakbot
Also you can check the list of available vip signal channels in the bot. by pressing Channels button.
BNB Could Drop Below $600
BNB’s EMA lines are currently very close to each other, indicating a lack of clear trend direction. This consolidation suggests market indecision, with neither bulls nor bears taking control.
Despite this, BNB has been in the spotlight recently, with its trading volume surpassing Solana and meme coins like TST gaining attention within the BNB ecosystem.
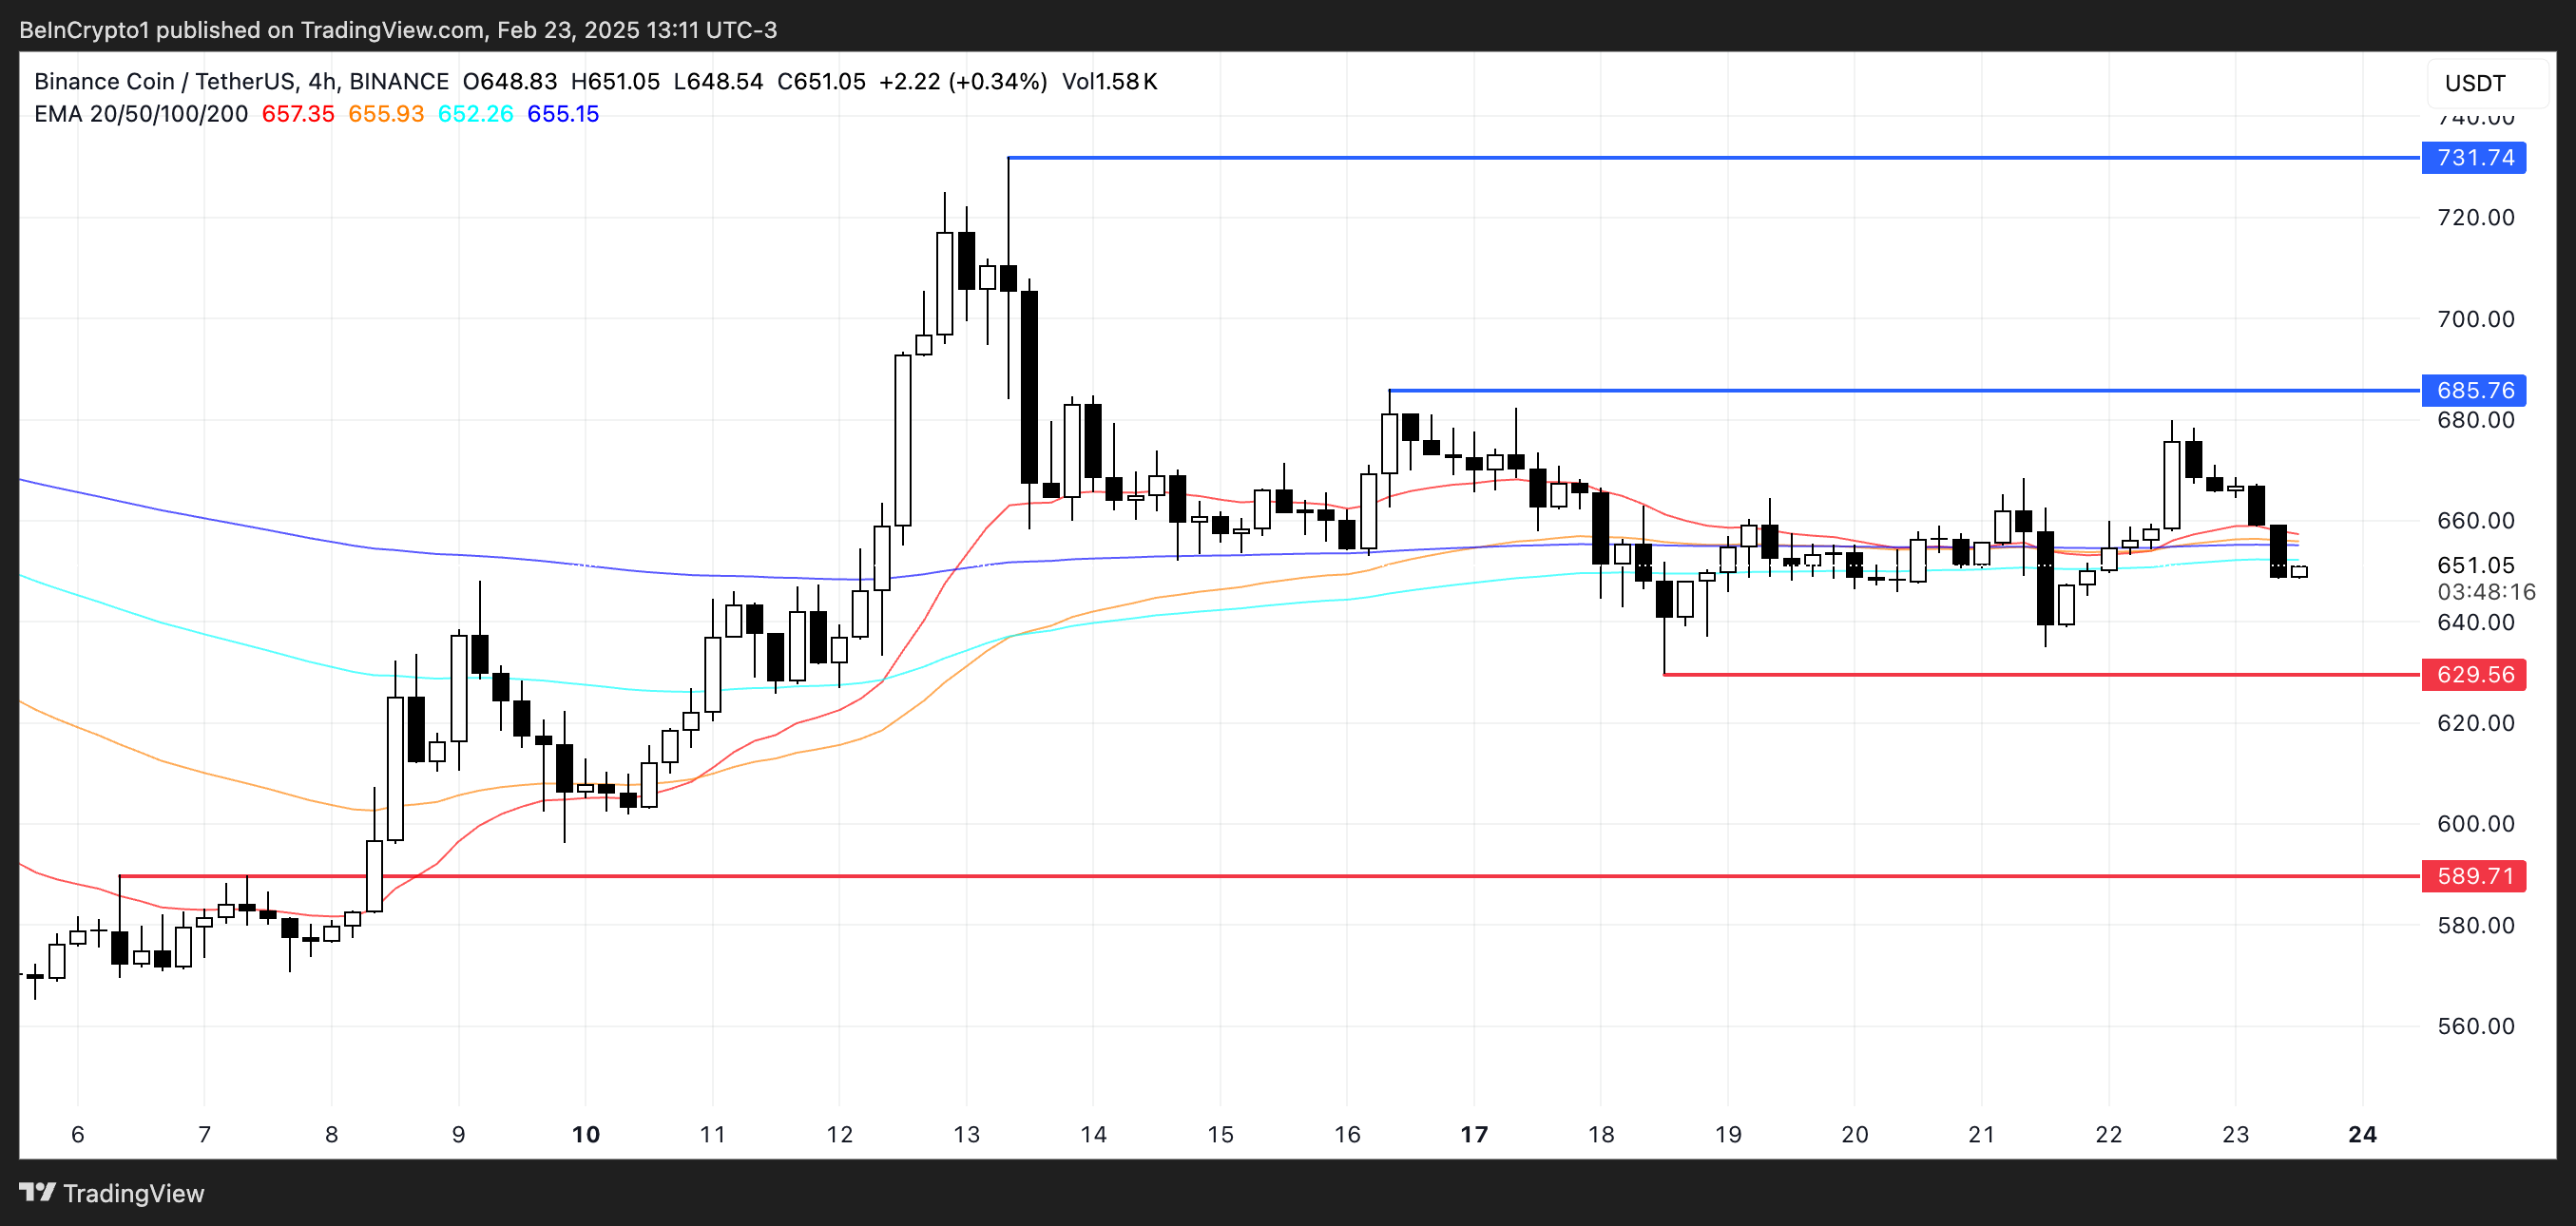
If it can regain positive momentum, it could test the resistance at $685, and breaking this level could push the price up to $731.
However, if a downtrend emerges, BNB price could test support at $629. Losing this level could lead to a decline to $589, marking its first drop below $600 since February 8.


