
BNB Price Analysis: Bearish Momentum Builds After Recent All-Time High

In Brief
- BNB price faces a downtrend after reaching an all-time high, with ADX rising to 31, signaling intensifying bearish momentum.
- Below the Ichimoku Cloud, BNB shows weakening bullish signals, flat spans, and increased selling pressure in the short term.
- A potential death cross in EMA lines highlights risks of further declines, with key support levels at $647, $622, and $593.
BNB price reached a new all-time high on December 4 but is now facing a downtrend, as indicated by several technical indicators. The surge in BNB’s ADX to 31, up from just 12 the day before, suggests that the bearish momentum is gaining strength, signaling the potential for more downward movement in the short term.
The price is currently below the Ichimoku Cloud, with weakening bullish signals and increased selling pressure. If this trend continues, BNB could experience further corrections, with the potential to test lower support levels in the coming days.
BNB Current Downtrend Indicates More Corrections Ahead
BNB’s ADX has surged to 31, up from 12 just a day ago, indicating that the current trend is gaining strength. The increase in ADX suggests that the trend has become more defined, and a reading above 25 typically signals a strong trend.
Since BNB price is currently in a downtrend, this higher ADX indicates that the bearish momentum is intensifying, and the price could experience further downward pressure if this trend continues.
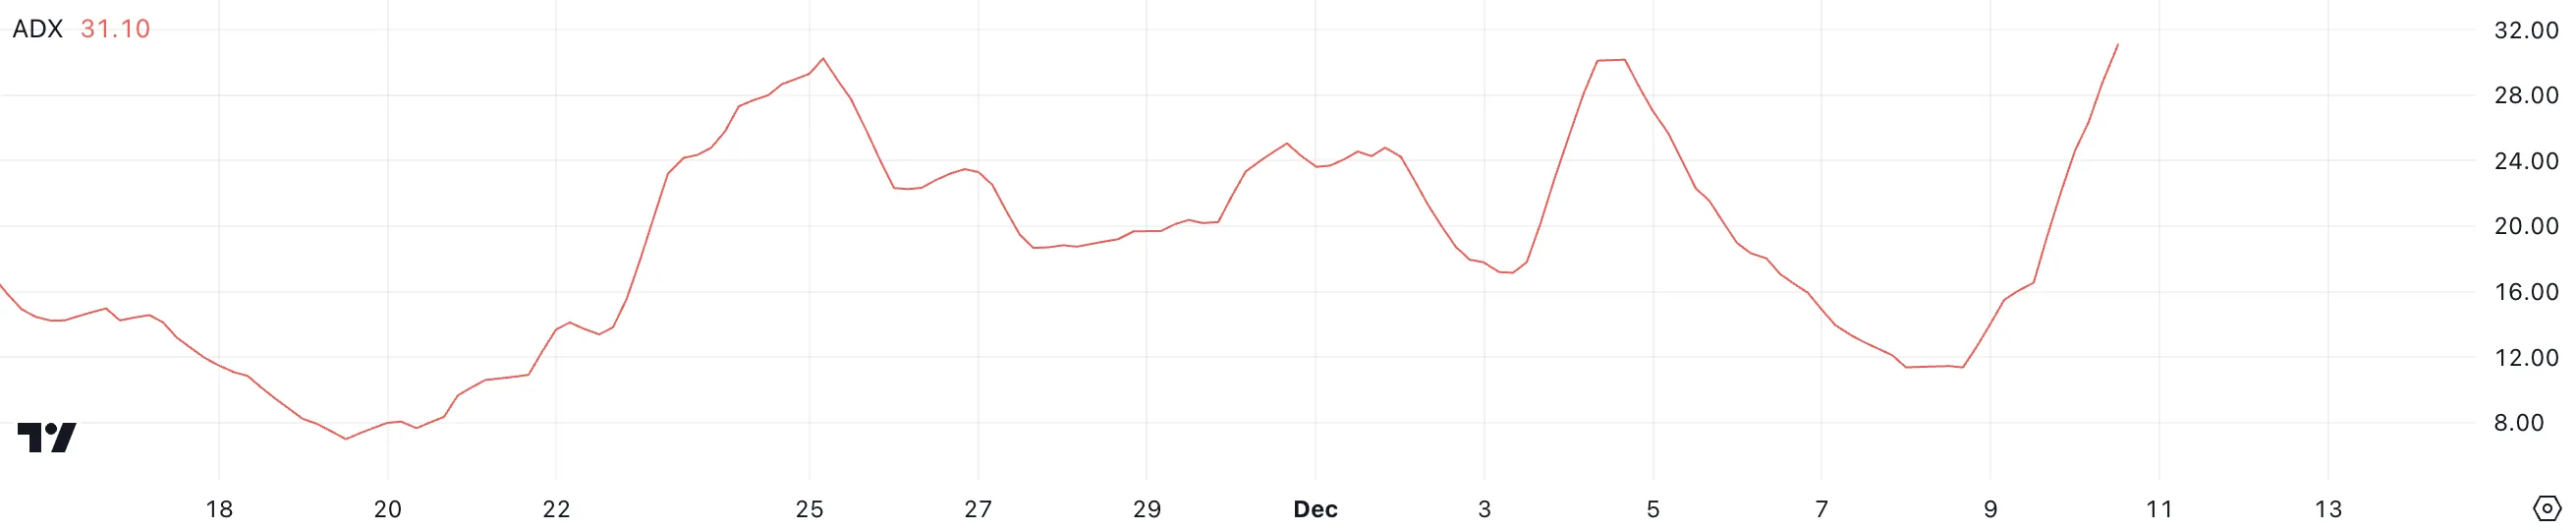
ADX, or the Average Directional Index, measures the strength of a trend regardless of whether it is bullish or bearish. Values above 25 indicate a strong trend, while values below 20 suggest weak or non-defined trends.
With BNB ADX at 31, this confirms that the downtrend is strengthening. Unless a reversal occurs, the market is likely to see continued selling pressure in the short term.
Get to know Godleak
Godleak crypto signal is a service which provide profitable crypto and forex signals for trading. Godleak tried to provide you signals of best crypto vip channels in the world.
It means that you don’t need to buy individual crypto signal vip channels that have expensive prices. We bought all for you and provide you the signals with bot on telegram without even a second of delay.

Godleak crypto leak service have multiple advantages in comparision with other services:
- Providing signal of +160 best crypto vip channels in the world
- Using high tech bot to forward signals
- Without even a second of delay
- Joining in +160 separated channels on telegram
- 1 month, 3 months , 6 months and yearly plans
- Also we have trial to test our services before you pay for anything
For joining Godleak and get more information about us only need to follow godleak bot on telegram and can have access to our free vip channels. click on link bellow and press start button to see all features
Join for Free
☟☟☟☟☟
https://t.me/Godleakbot
Also you can check the list of available vip signal channels in the bot. by pressing Channels button.
 
BNB Ichimoku Cloud Shows Bearish Signals
BNB price is currently below the Ichimoku Cloud, suggesting that it’s in a bearish phase. The green span of the cloud has turned thin and is losing its momentum, while the leading span lines appear to be flat.
This scenario points to a weakening uptrend, and the price could face resistance if it tries to recover and move above the cloud. Additionally, the price falling below the cloud signals increased selling pressure, which could push the price further downward in the short term.
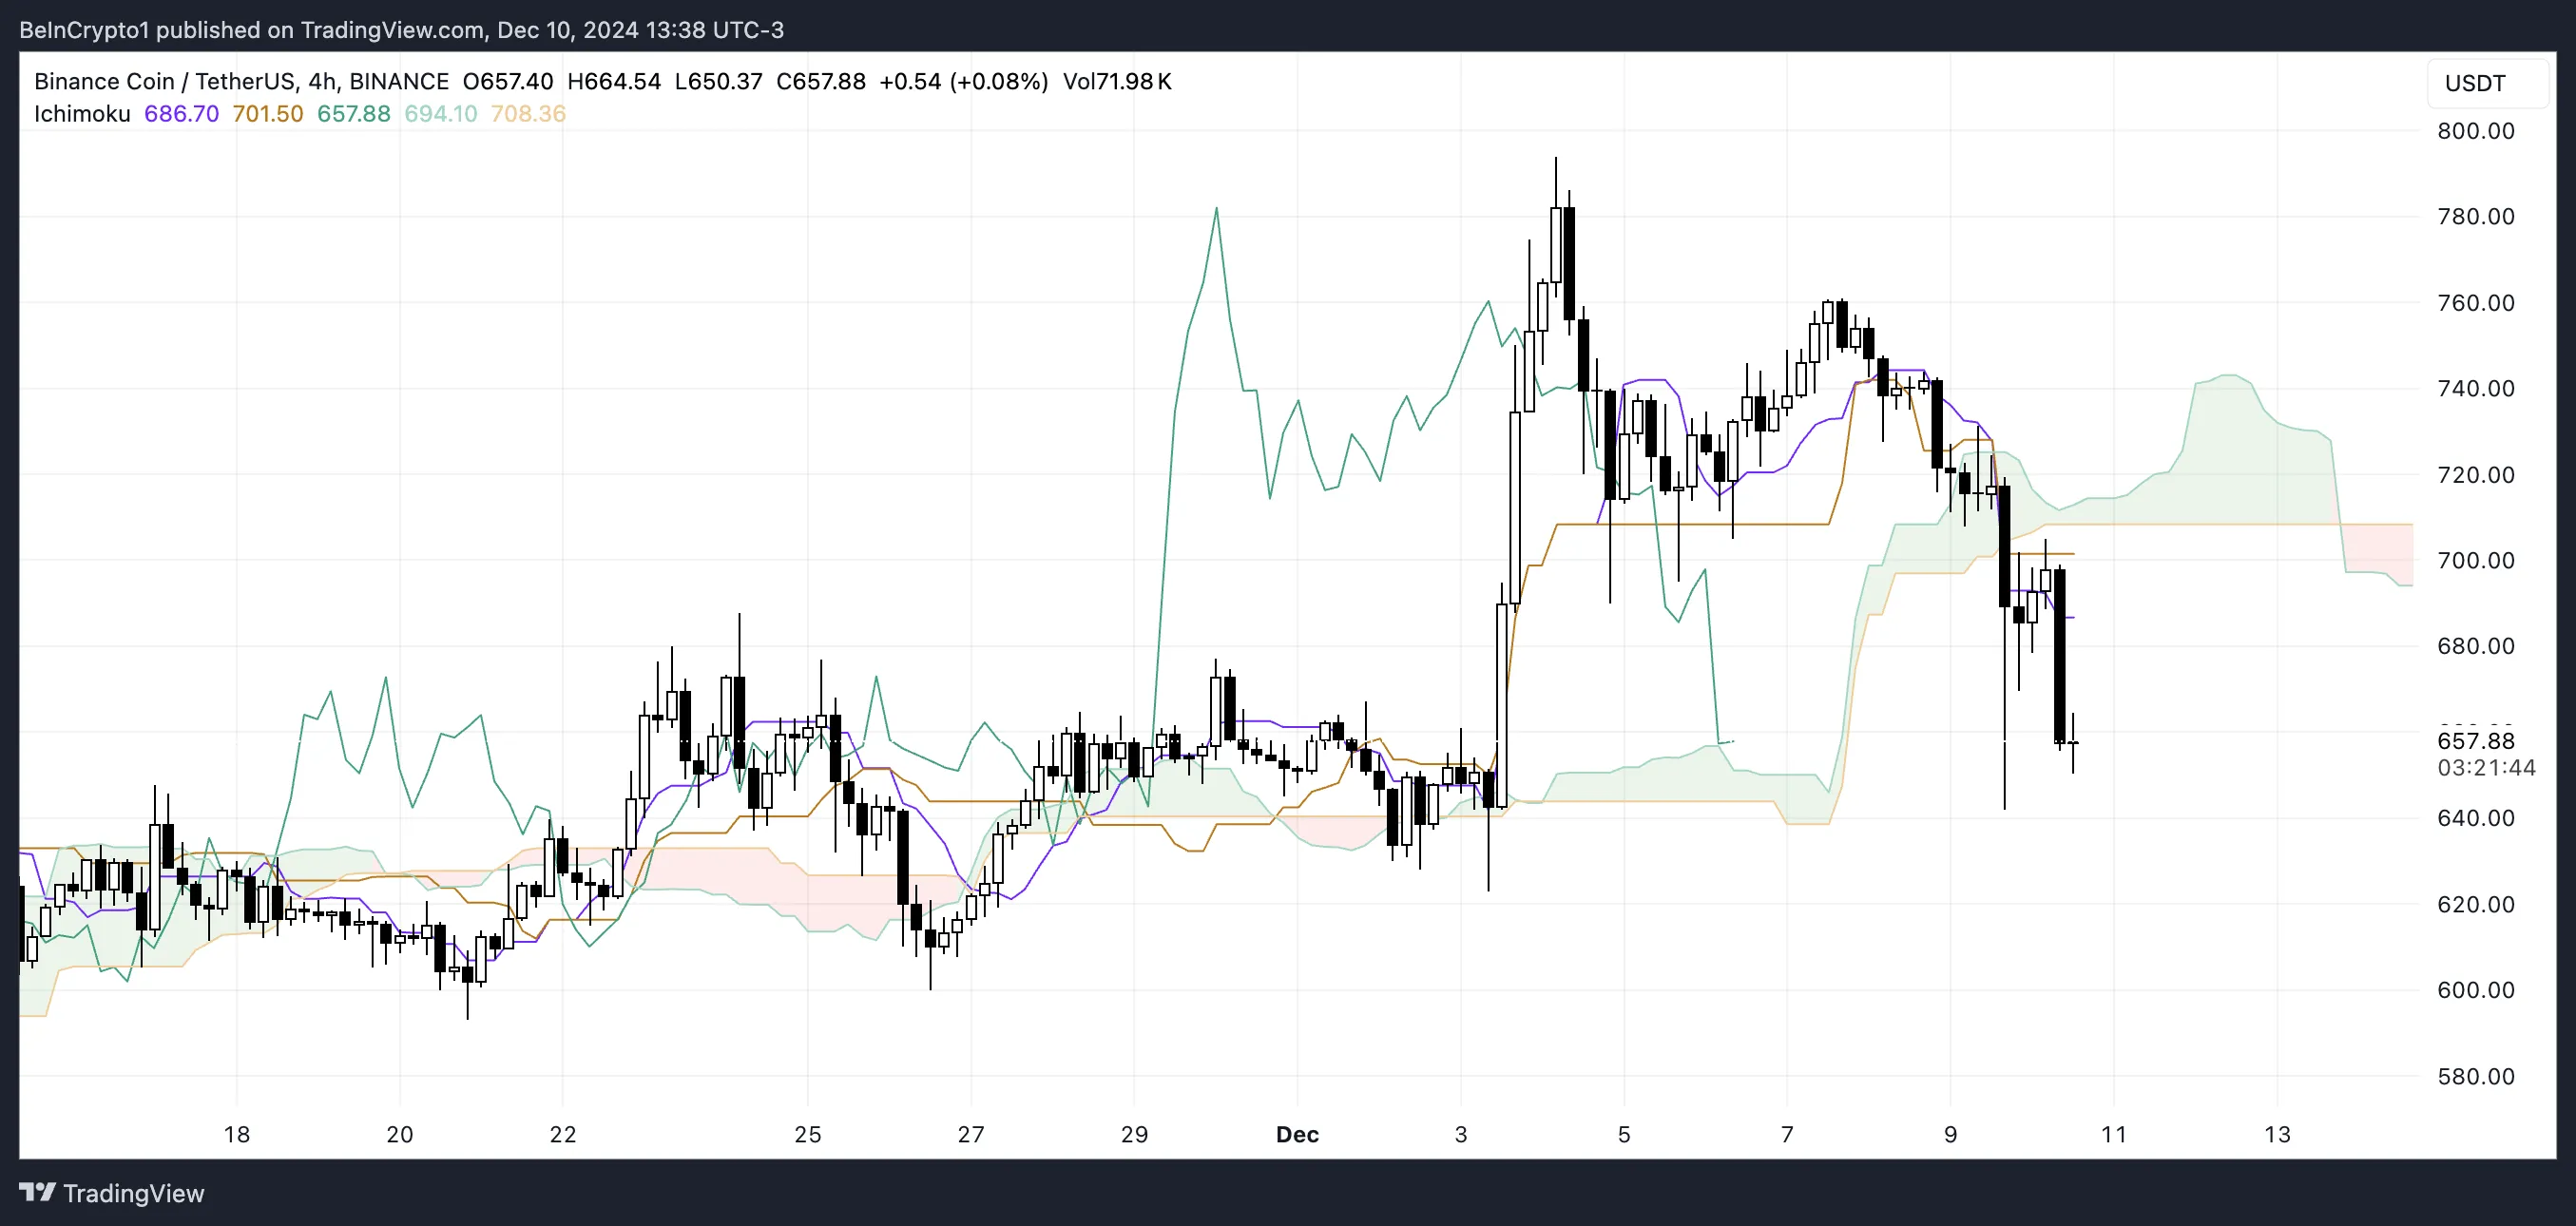
Looking at the indicator lines, the Tenkan-sen (blue line) is below the Kijun-sen (red line), confirming that bearish momentum is present. The gap between the two lines suggests that the downward trend is gaining strength, as the shorter-term Tenkan-sen continues to remain beneath the slower Kijun-sen.
The cloud’s red color further supports this bearish outlook, indicating that market sentiment is negative. If BNB fails to break above the cloud, it may continue to face selling pressure, and its price could test lower support levels in the near future.
BNB Price Prediction: Can BNB Fall Below $600 In December?
The BNB EMA Lines indicate a bearish signal with the formation of a death cross, as the shortest line has crossed below the others. This technical pattern is commonly seen as a sign of weakening bullish momentum and suggests that BNB could face further declines.
If the current downtrend persists and the $647 support level fails to hold, BNB price may see a more significant drop, potentially testing $622 and even $593. These levels represent key support zones that will be critical for determining the strength of the downtrend and the possibility of further losses.
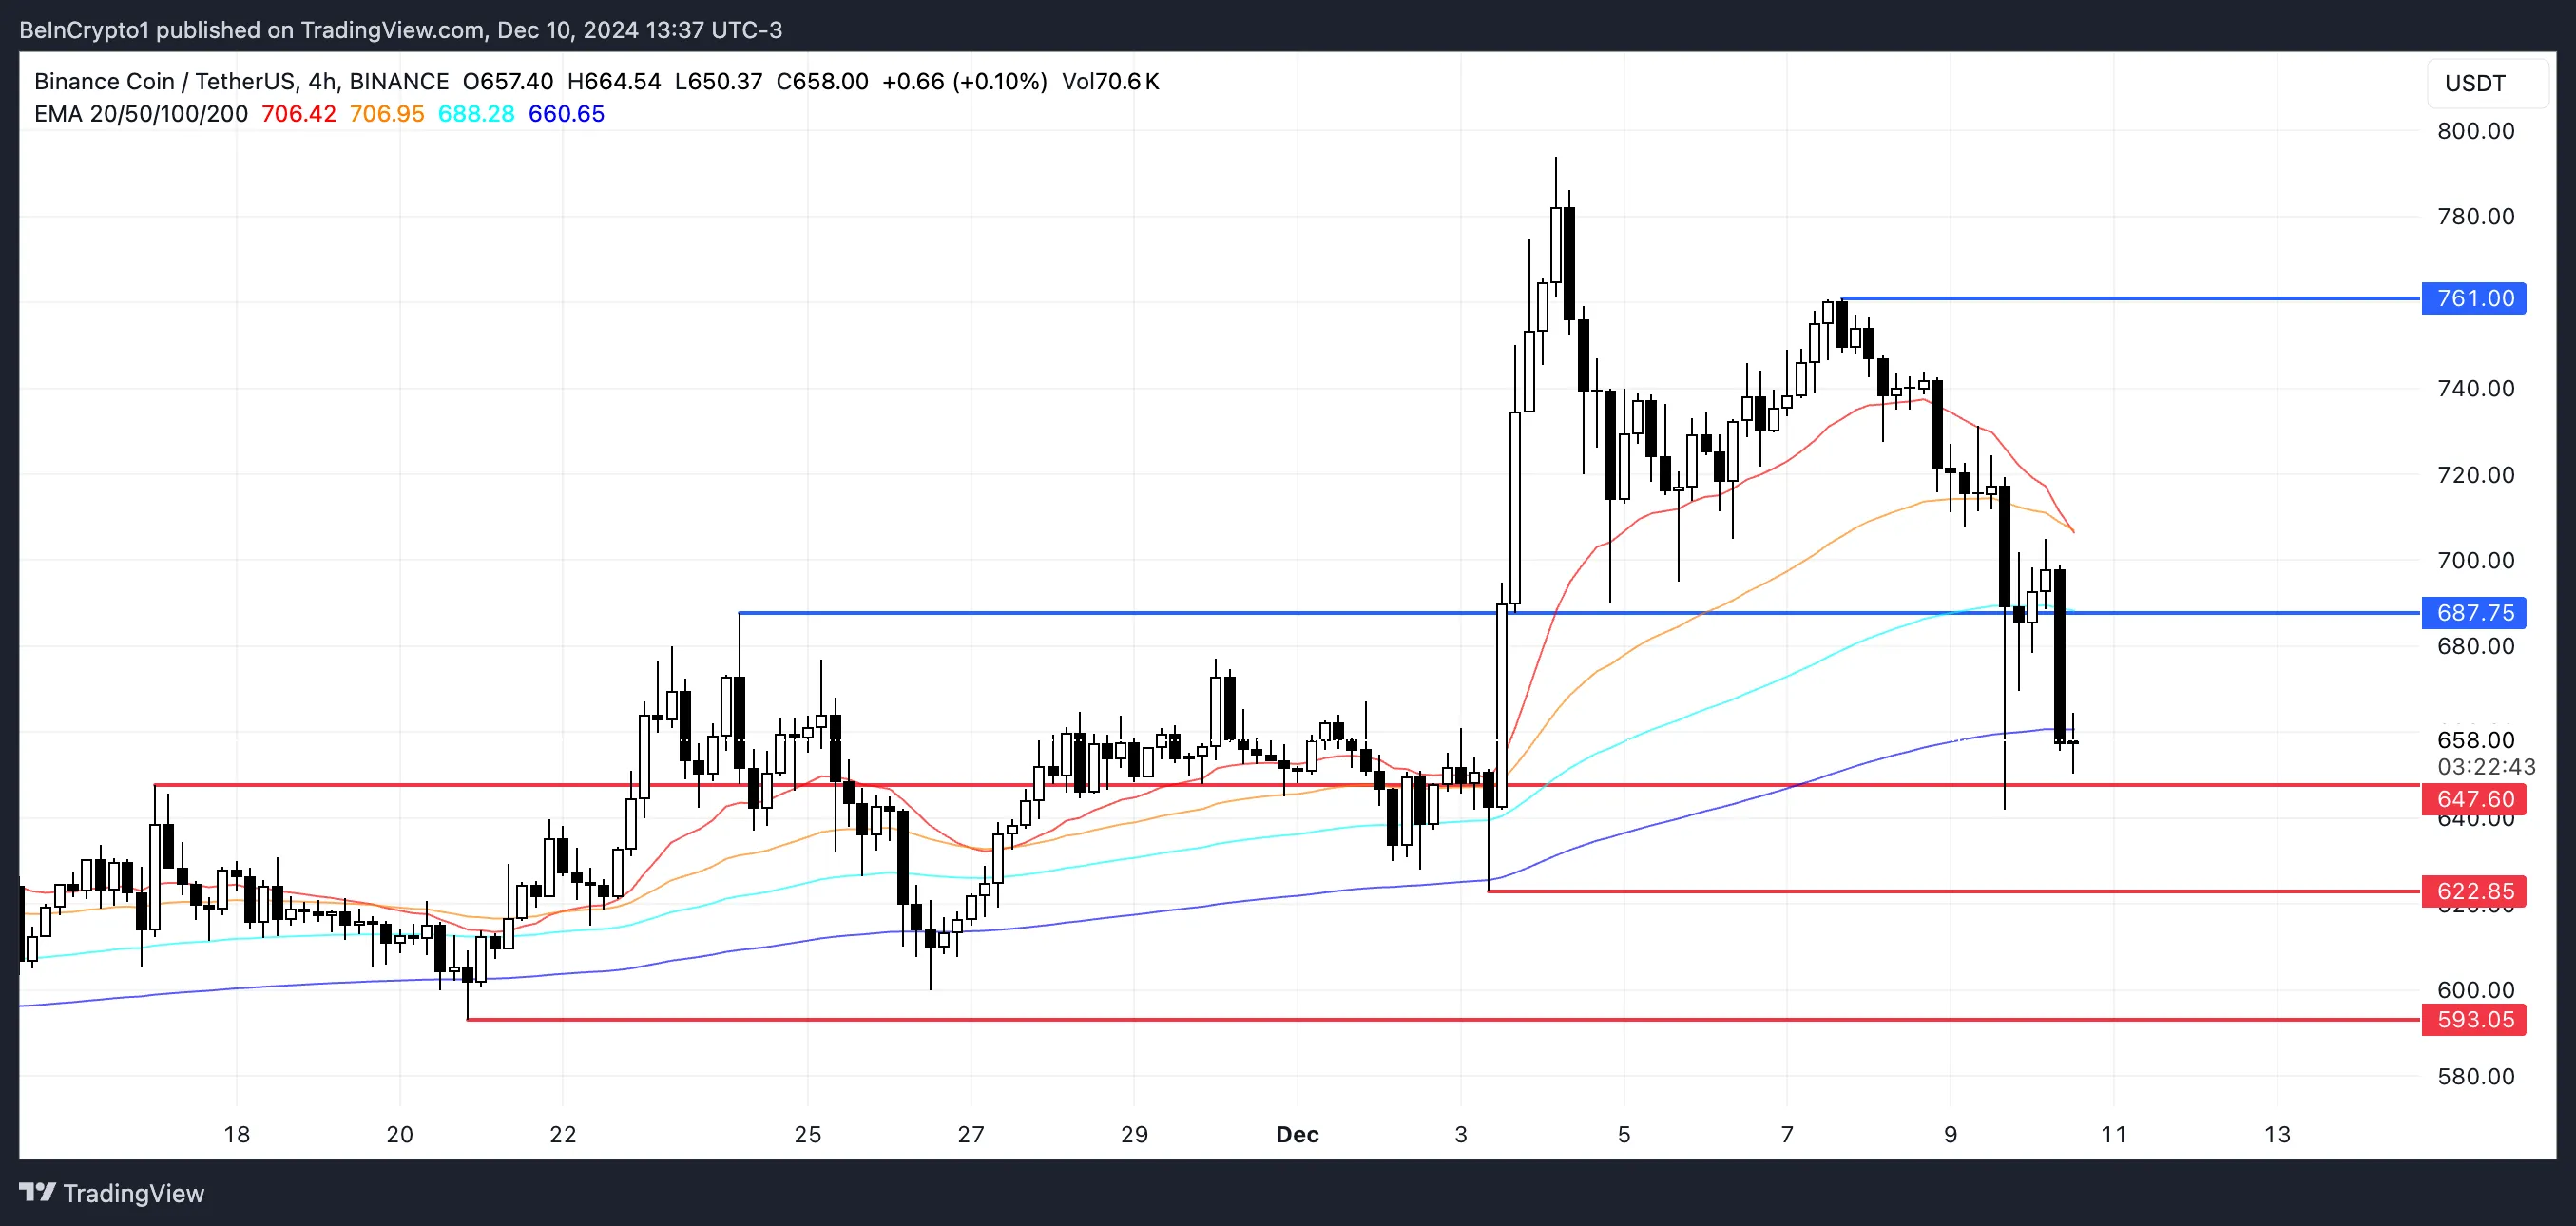
However, if the market sentiment shifts and the downtrend reverses, BNB could find support at the $647 level and rise toward resistance at $687.
A break above this level could signal a reversal of the current downtrend and pave the way for BNB to test higher levels, such as the $761 resistance.


