
Hedera Struggles to Maintain Momentum After 40% Correction

In Brief
- Hedera climbs above $0.21 but struggles to confirm a bullish reversal after a 41% correction in the past 30 days.
- ADX at 23.2 signals weak trend strength, while the Ichimoku Cloud setup reinforces bearish momentum and strong resistance.
- EMAs remain bearish, with key support at $0.17; a breakdown could trigger a 42% drop, while a breakout may push HBAR toward $0.40.
Hedera (HBAR) has climbed above $0.21 in the last 24 hours. However, it is still attempting to recover from a 40% correction over the past 30 days. Despite this short-term rebound, technical indicators suggest that bearish momentum remains in control.
ADX readings indicate that the current trend lacks strength, while the Ichimoku Cloud setup reinforces that resistance remains dominant. With EMAs still signaling a bearish structure, HBAR faces key levels that could determine whether it continues to recover or risks further downside.
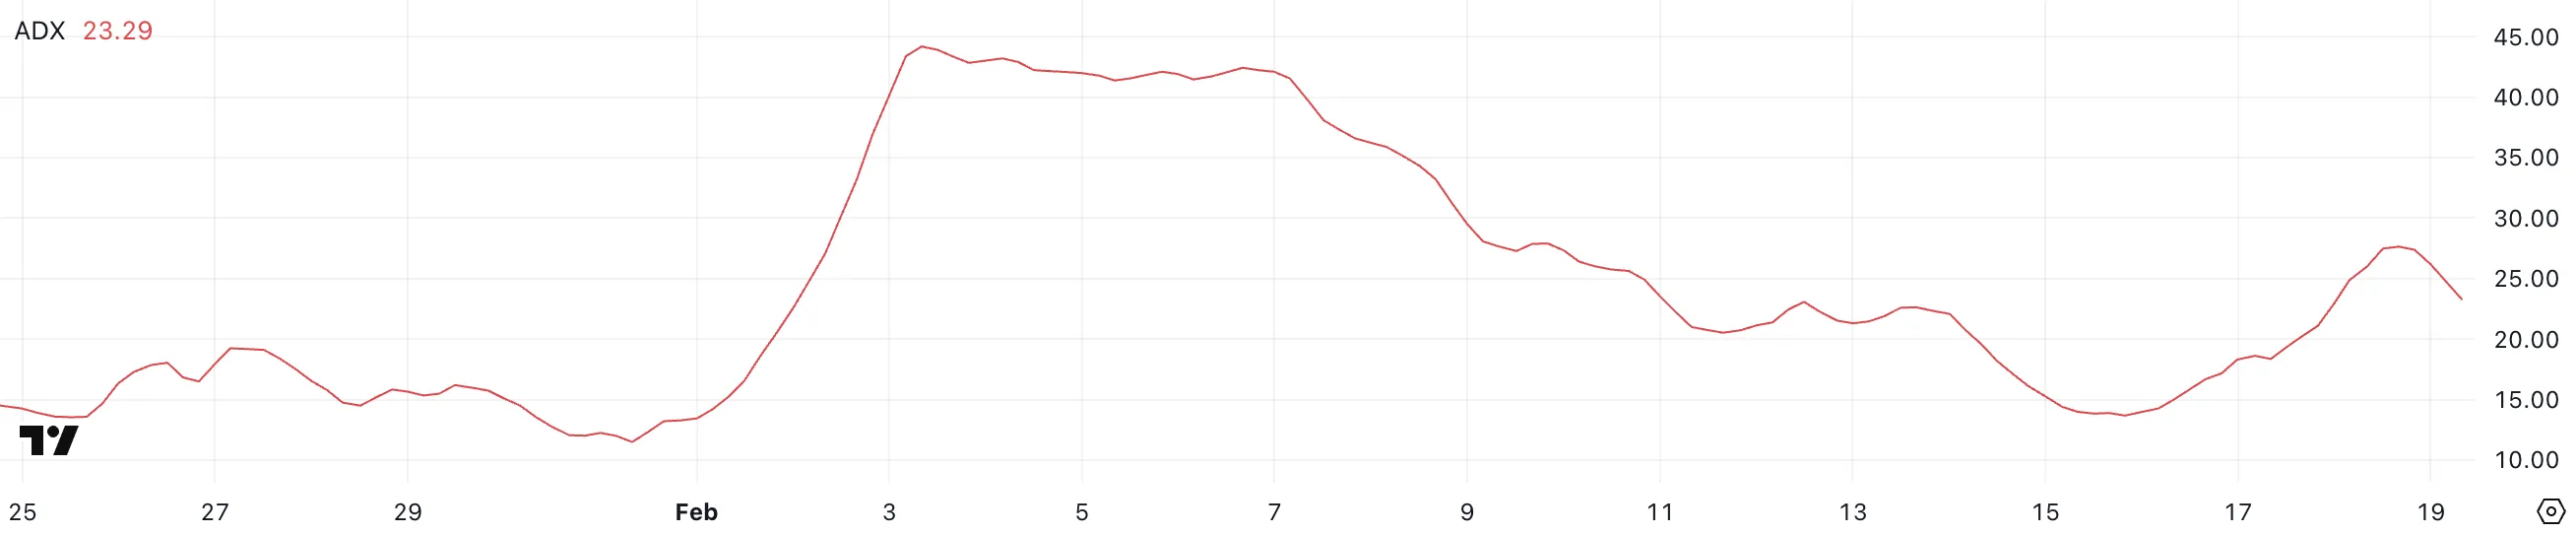
HBAR ADX Shows the Current Trend Isn’t That Strong
Hedera’s ADX is currently at 23.2, down from 27.4 yesterday after surging from 13.8 just four days ago. This recent spike, followed by a slight decline, suggests that trend strength has been increasing but is now losing some momentum.
ADX measures the overall strength of a trend, not its direction. While Hedera has been attempting to shift from a downtrend into an uptrend, the current decrease in ADX indicates that this transition is not yet firmly established.
For a strong bullish trend to develop, ADX would need to hold above 25 and ideally continue rising.
The Average Directional Index (ADX) gauges trend strength on a scale from 0 to 100. Readings above 25 indicate a strong trend, while values below 20 suggest weak or range-bound price action.
Hedera ADX at 23.2 places it just below the threshold of a strong trend, meaning that while some momentum has built up, it hasn’t yet confirmed a definitive shift to an uptrend. If ADX begins climbing again and moves past 25, it could signal that buying pressure is strengthening and the reversal is gaining traction.
However, if it continues to drop, it may indicate that the recent attempt to break out of the downtrend is losing steam, leaving HBAR vulnerable to further consolidation or even a renewed decline.
Get to know Godleak
Godleak crypto signal is a service which provide profitable crypto and forex signals for trading. Godleak tried to provide you signals of best crypto vip channels in the world.
It means that you don’t need to buy individual crypto signal vip channels that have expensive prices. We bought all for you and provide you the signals with bot on telegram without even a second of delay.

Godleak crypto leak service have multiple advantages in comparision with other services:
- Providing signal of +160 best crypto vip channels in the world
- Using high tech bot to forward signals
- Without even a second of delay
- Joining in +160 separated channels on telegram
- 1 month, 3 months , 6 months and yearly plans
- Also we have trial to test our services before you pay for anything
For joining Godleak and get more information about us only need to follow godleak bot on telegram and can have access to our free vip channels. click on link bellow and press start button to see all features
Join for Free
☟☟☟☟☟
https://t.me/Godleakbot
Also you can check the list of available vip signal channels in the bot. by pressing Channels button.
 
HBAR Ichimoku Cloud Shows a Bearish Setup
The Ichimoku Cloud chart for Hedera remains in a bearish setup, with the price trading below the red cloud. That signals continued downside momentum. The cloud (Kumo) is thick and projected to remain red, indicating strong resistance ahead and suggesting that the bearish trend is still intact.
The purple Tenkan-sen (conversion line) is now positioned below the orange Kijun-sen (baseline line). This reflects the lack of a confirmed bullish reversal.
However, the price has managed to climb above the purple Tenkan-sen. This signals a short-term recovery attempt, though it remains insufficient to confirm a trend shift.

The green Chikou Span (lagging line) remains well below the price and the cloud, showing that the HBAR market is still facing residual bearish pressure from previous price action.
For a meaningful trend reversal, the price would need to break above the orange Kijun-sen and eventually move into the cloud, reducing the influence of bearish momentum. If HBAR can surpass the cloud and flip it green, it would indicate a potential shift toward a bullish trend.
Until that happens, the Ichimoku setup suggests that HBAR is still struggling to gain strength. So, any upward movement needs further confirmation before signaling a sustained recovery.
Hedera Can Fall by a Further 42% If the Downtrend Gets Stronger
Hedera’s EMA lines suggest a bearish setup, with short-term moving averages positioned below long-term ones. This reinforces the ongoing downtrend.
This alignment indicates that selling pressure remains dominant, making it difficult for HBAR to establish a meaningful recovery unless momentum shifts. The price currently sits near a key support level of $0.17. If this level is tested and lost, HBAR could face a deeper decline toward $0.12, marking a potential 42% correction from current levels.
With the EMAs still trending downward, any short-term bounces would need to be met with sustained buying pressure to challenge the existing bearish structure.

However, if the price of Hedera can reverse the trend and short-term EMAs start crossing above long-term ones, it could regain bullish momentum.
In this case, the first major resistance to watch is $0.25. If that level is broken, HBAR could continue climbing toward $0.35.
A sustained uptrend could even push HBAR back to $0.40, which was last seen in mid-January. That would represent a 90% upside from current prices.


