
Shiba Inu (SHIB) Shows Mixed Signals Amid 30% Monthly Decline
In Brief
- Shiba Inu drops 30% in 30 days but shows mixed signals for a potential trend reversal.
- RSI recovers from oversold levels, while BBTrend turns positive, indicating cautious buying interest.
- EMA lines remain bearish, suggesting persistent selling pressure despite short-term recovery signals.
Shiba Inu (SHIB) has been trading well below $0.000020 for the past month, experiencing a 30% decline in February. Its market cap now stands at $8.25 billion. Despite this downturn, SHIB’s technical indicators are showing mixed signals, suggesting the possibility of a trend reversal.
RSI has recently recovered from oversold levels, and BBTrend has turned positive, indicating a potential shift in buying interest. However, its EMA lines remain in a bearish setup, showing that SHIB is still facing challenges in establishing a strong uptrend.
SHIB RSI Is Now Neutral After Becoming Oversold
SHIB’s RSI is currently at 34.5, after dipping to 21.6 a few hours ago. This marks a sharp decline from 56.5 just two days ago.
RSI, or Relative Strength Index, measures the speed and change of price movements, helping traders identify overbought or oversold conditions.
It ranges from 0 to 100, with values above 70 indicating overbought conditions and below 30 suggesting oversold levels. SHIB’s recent drop into oversold territory marked the first time this occurred since February 3, indicating intense selling pressure.
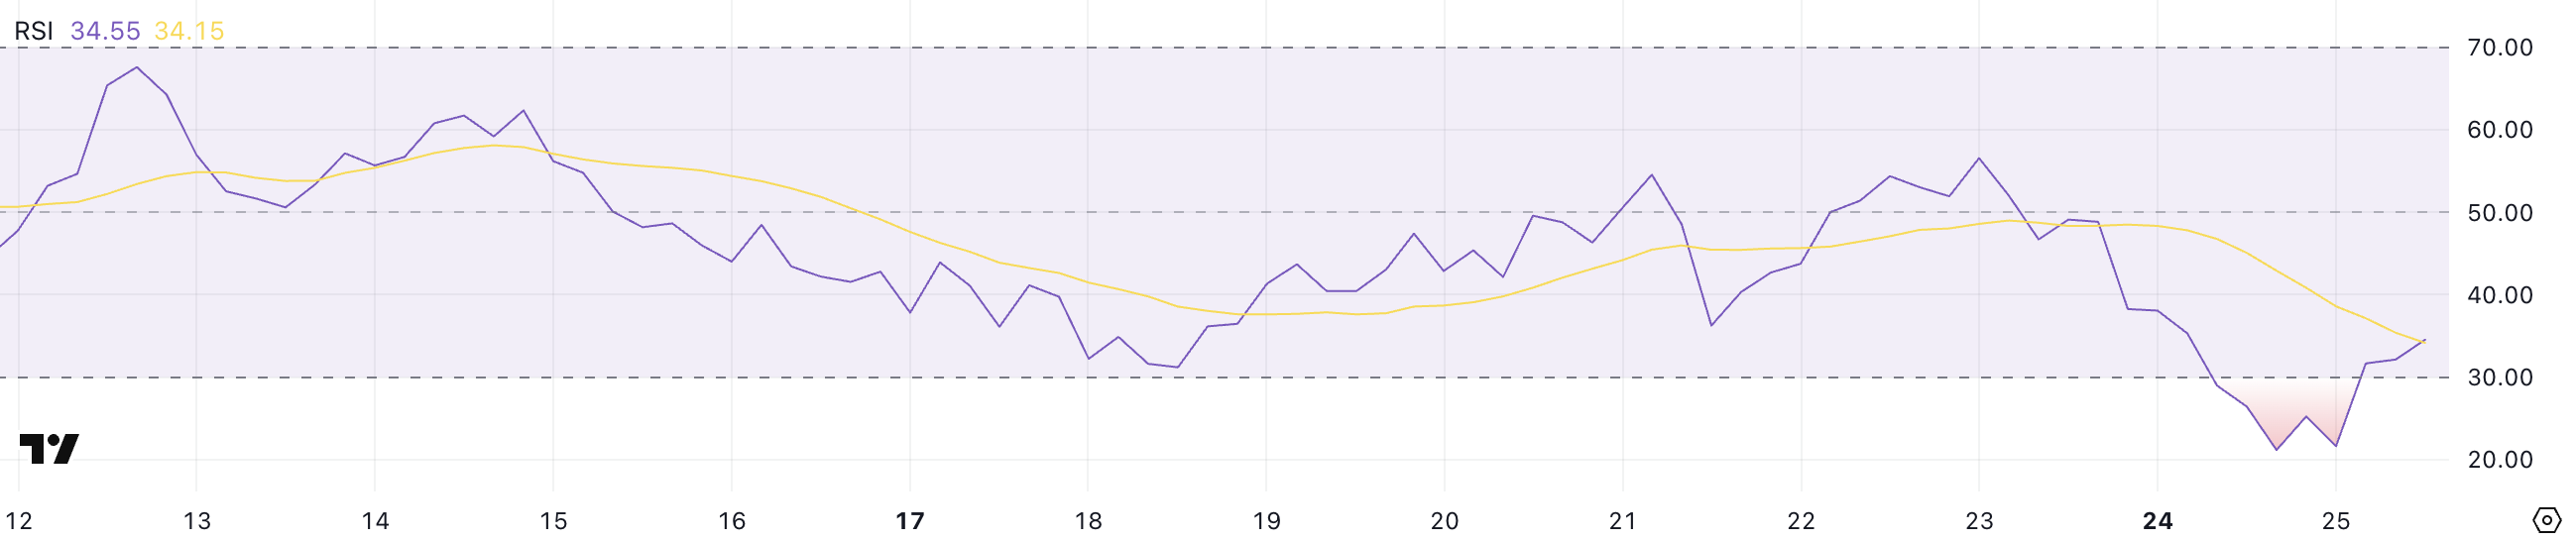
With RSI now at 34.5, SHIB is recovering from oversold conditions but remains in a fragile state. This level suggests that selling momentum is slowing, possibly setting the stage for a short-term rebound.
However, the current RSI is still relatively low, indicating that bearish sentiment persists. If RSI continues to rise above 40, it could signal a shift toward renewed buying interest.
Conversely, if it falls back below 30, SHIB could face another wave of selling pressure.
Shiba Inu BBTrend Is Now Positive, But Not Sustainably Strong Yet
Shiba Inu’s BBTrend turned positive between yesterday and today, currently sitting at 5 after rising from -1.55 just a day ago. BBTrend is an indicator derived from Bollinger Bands that measures the strength and direction of a trend.
Positive values indicate bullish momentum, while negative values signal bearish pressure.
SHIB’s BBTrend had been negative for six consecutive days, hitting a low of -7.58 on February 20. This low reflected strong selling pressure before this recent reversal.
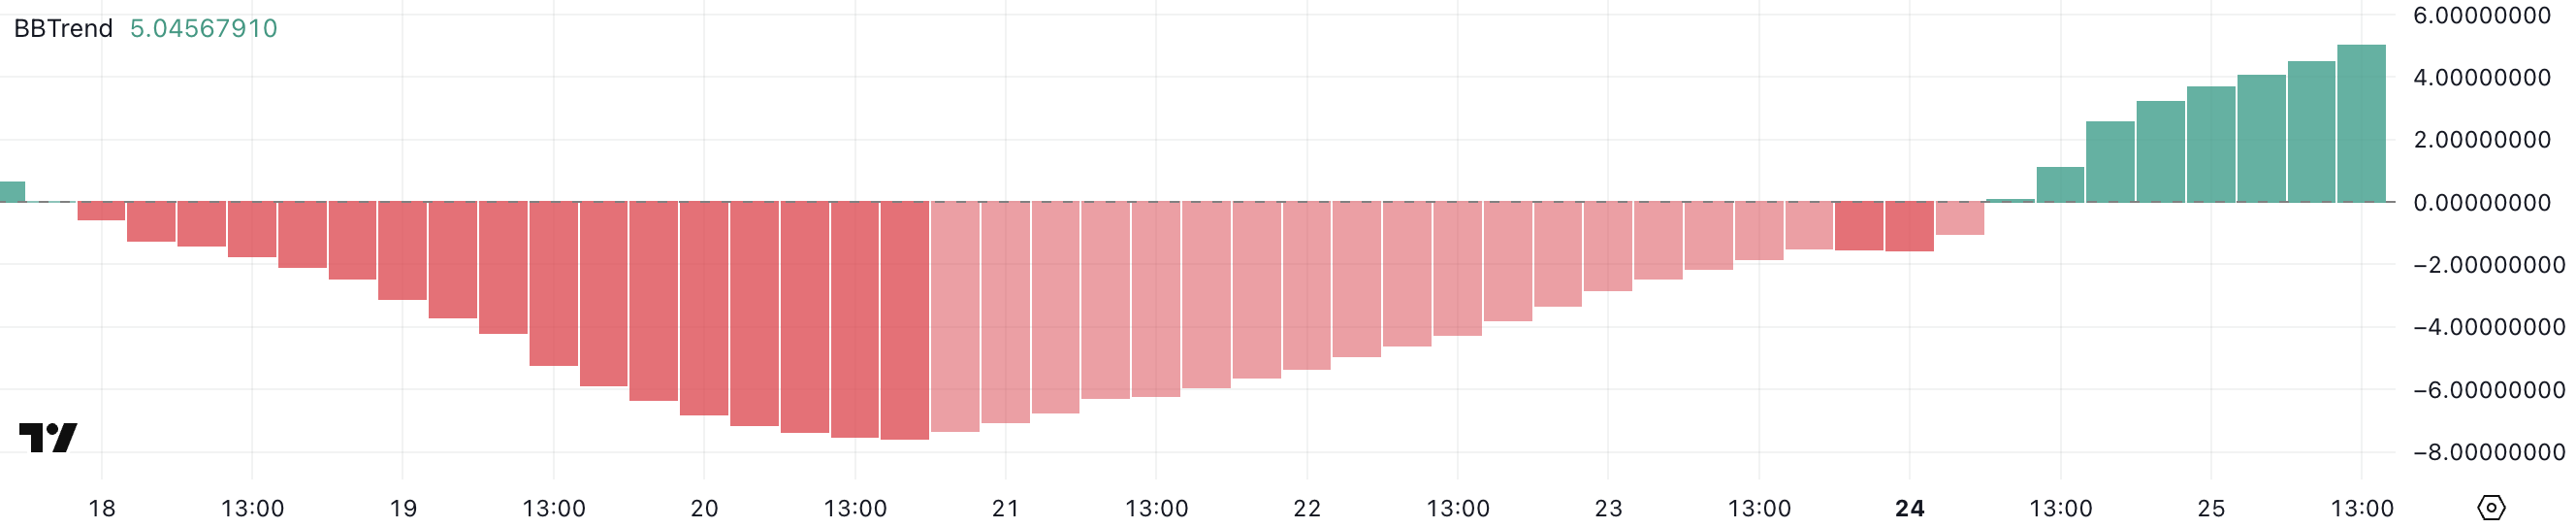
With BBTrend now at 5, Shiba Inu is showing signs of renewed buying interest and potential bullish momentum. This positive shift suggests that buyers are gaining control, increasing the likelihood of a short-term uptrend.
However, while BBTrend’s positive turn is encouraging, it is still at relatively low levels compared to previous rallies. If BBTrend continues to rise, it would confirm strengthening bullish sentiment.
On the other hand, if it starts to decline again, it could indicate that buying momentum is fading, potentially leading to a price pullback.
Get to know Godleak
Godleak crypto signal is a service which provide profitable crypto and forex signals for trading. Godleak tried to provide you signals of best crypto vip channels in the world.
It means that you don’t need to buy individual crypto signal vip channels that have expensive prices. We bought all for you and provide you the signals with bot on telegram without even a second of delay.

Godleak crypto leak service have multiple advantages in comparision with other services:
- Providing signal of +160 best crypto vip channels in the world
- Using high tech bot to forward signals
- Without even a second of delay
- Joining in +160 separated channels on telegram
- 1 month, 3 months , 6 months and yearly plans
- Also we have trial to test our services before you pay for anything
For joining Godleak and get more information about us only need to follow godleak bot on telegram and can have access to our free vip channels. click on link bellow and press start button to see all features
Join for Free
☟☟☟☟☟
https://t.me/Godleakbot
Also you can check the list of available vip signal channels in the bot. by pressing Channels button.
Shiba Inu Could Rally 42% If a Golden Cross Forms
Shiba Inu price recently dropped below $0.000014 for the first time since early February, reflecting a continuation of its bearish trend. Its EMA lines are still in a bearish setup, with short-term EMAs positioned below the long-term ones, indicating persistent selling pressure.
If this downtrend continues, SHIB could test the support at $0.0000116, potentially falling below $0.000012 for the first time since August 2024. The wide separation between the EMAs suggests strong bearish momentum, making it difficult for buyers to regain control.
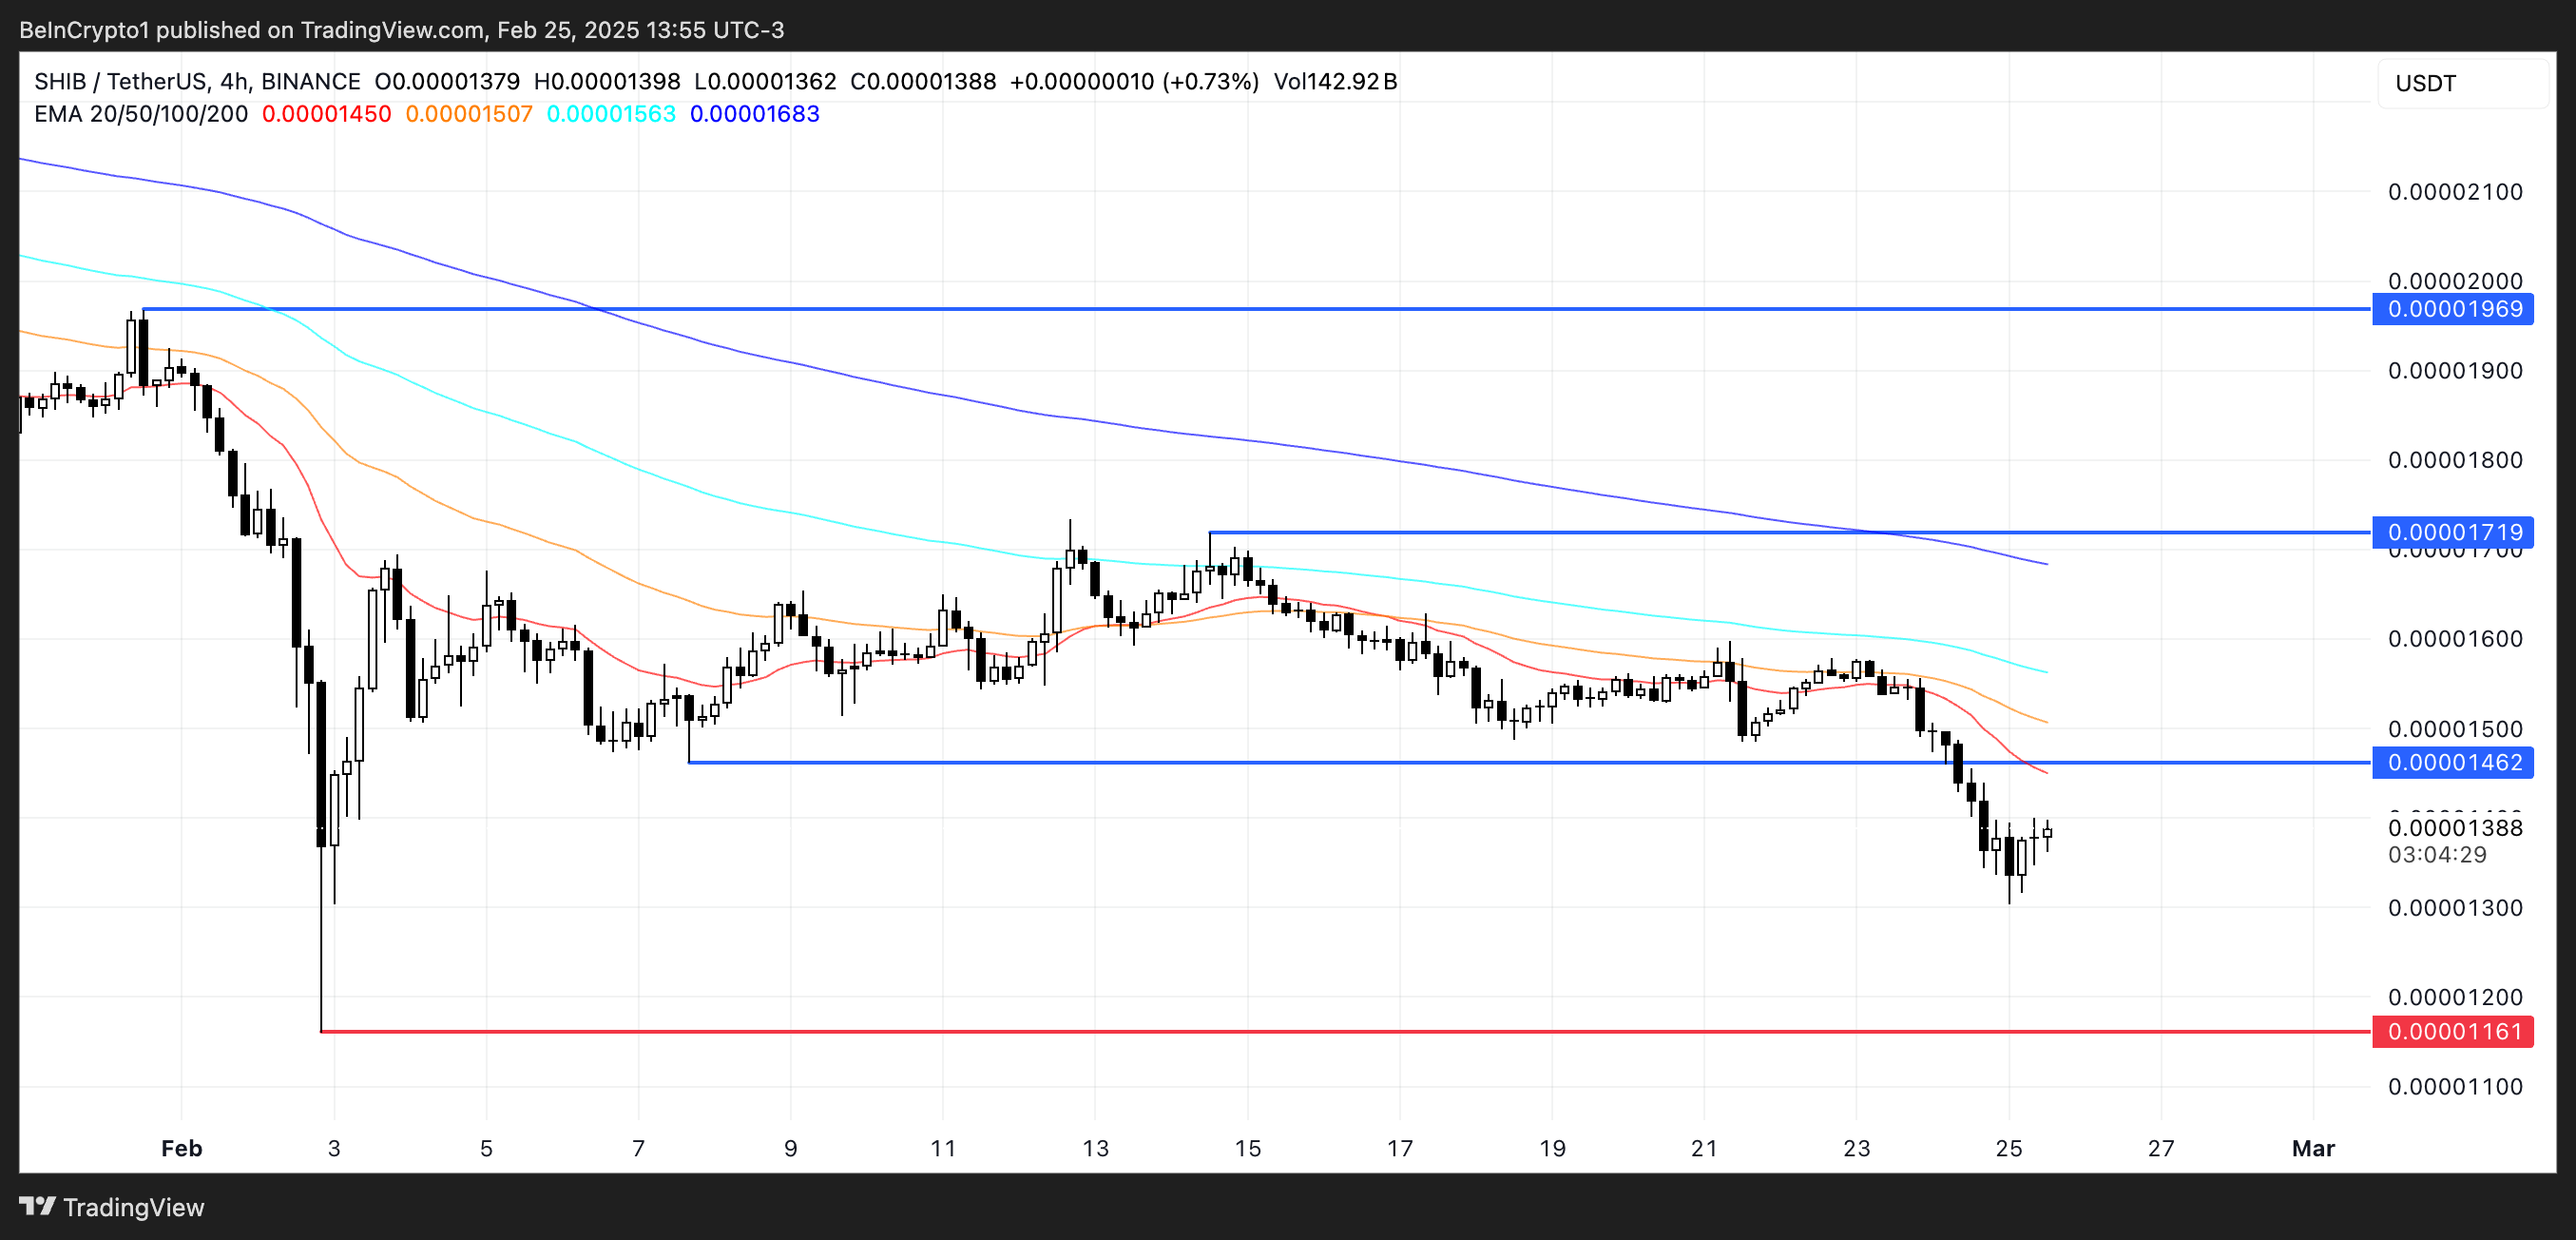
However, if SHIB manages to reverse this trend, it could test the resistance at $0.0000146. Breaking this level could trigger a rally toward $0.000017. Also, if that resistance is surpassed, Shiba Inu price could continue rising to $0.0000196.
A strong buying momentum could drive the meme coin to break above $0.00002 for the first time since late January.
For this bullish scenario to play out, the short-term EMAs would need to cross above the long-term ones, confirming a trend reversal. Until then, the bearish EMA setup suggests that downward pressure is likely to persist.


