
Solana (SOL) Price Drops 17% in a Week as It Struggles Below $200

In Brief
- Solana price drops 17% as bearish momentum persists, trading near $200 while market sentiment remains mixed.
- Solana’s downtrend shows signs of easing, but key resistance levels must be broken for a potential bullish reversal.
- Solana consolidates near $200 as traders watch for a breakout or further decline toward critical support levels.
Solana (SOL) price has seen strong corrections over the past week, dropping 17% and falling below the $100 billion market cap. The Ichimoku Cloud chart indicates that bearish momentum remains dominant, with SOL trading below key trend indicators and reflecting downside pressure.
Meanwhile, the Directional Movement Index (DMI) suggests that the strength of the current downtrend is still intact, though selling pressure appears to be weakening. With technical indicators showing mixed signals, SOL’s next move will depend on whether it can regain momentum or continue its decline toward lower support levels.
SOL Ichimoku Cloud Show the Bearish Momentum Is Still Here
The Ichimoku Cloud chart for Solana shows a predominantly bearish setup. The price is trading below the cloud, and the cloud itself is shaded red, indicating continued downside pressure.
The Kijun-sen (red line) remains above the price, reinforcing the bearish bias, while the Tenkan-sen (blue line) is also positioned below the cloud, suggesting that short-term momentum is still weak.
Additionally, the Senkou Span A (green cloud boundary) is trending below Senkou Span B (red cloud boundary), signaling that the broader trend remains downward. The fact that the price is below both the conversion and base lines further confirms that bears are in control.
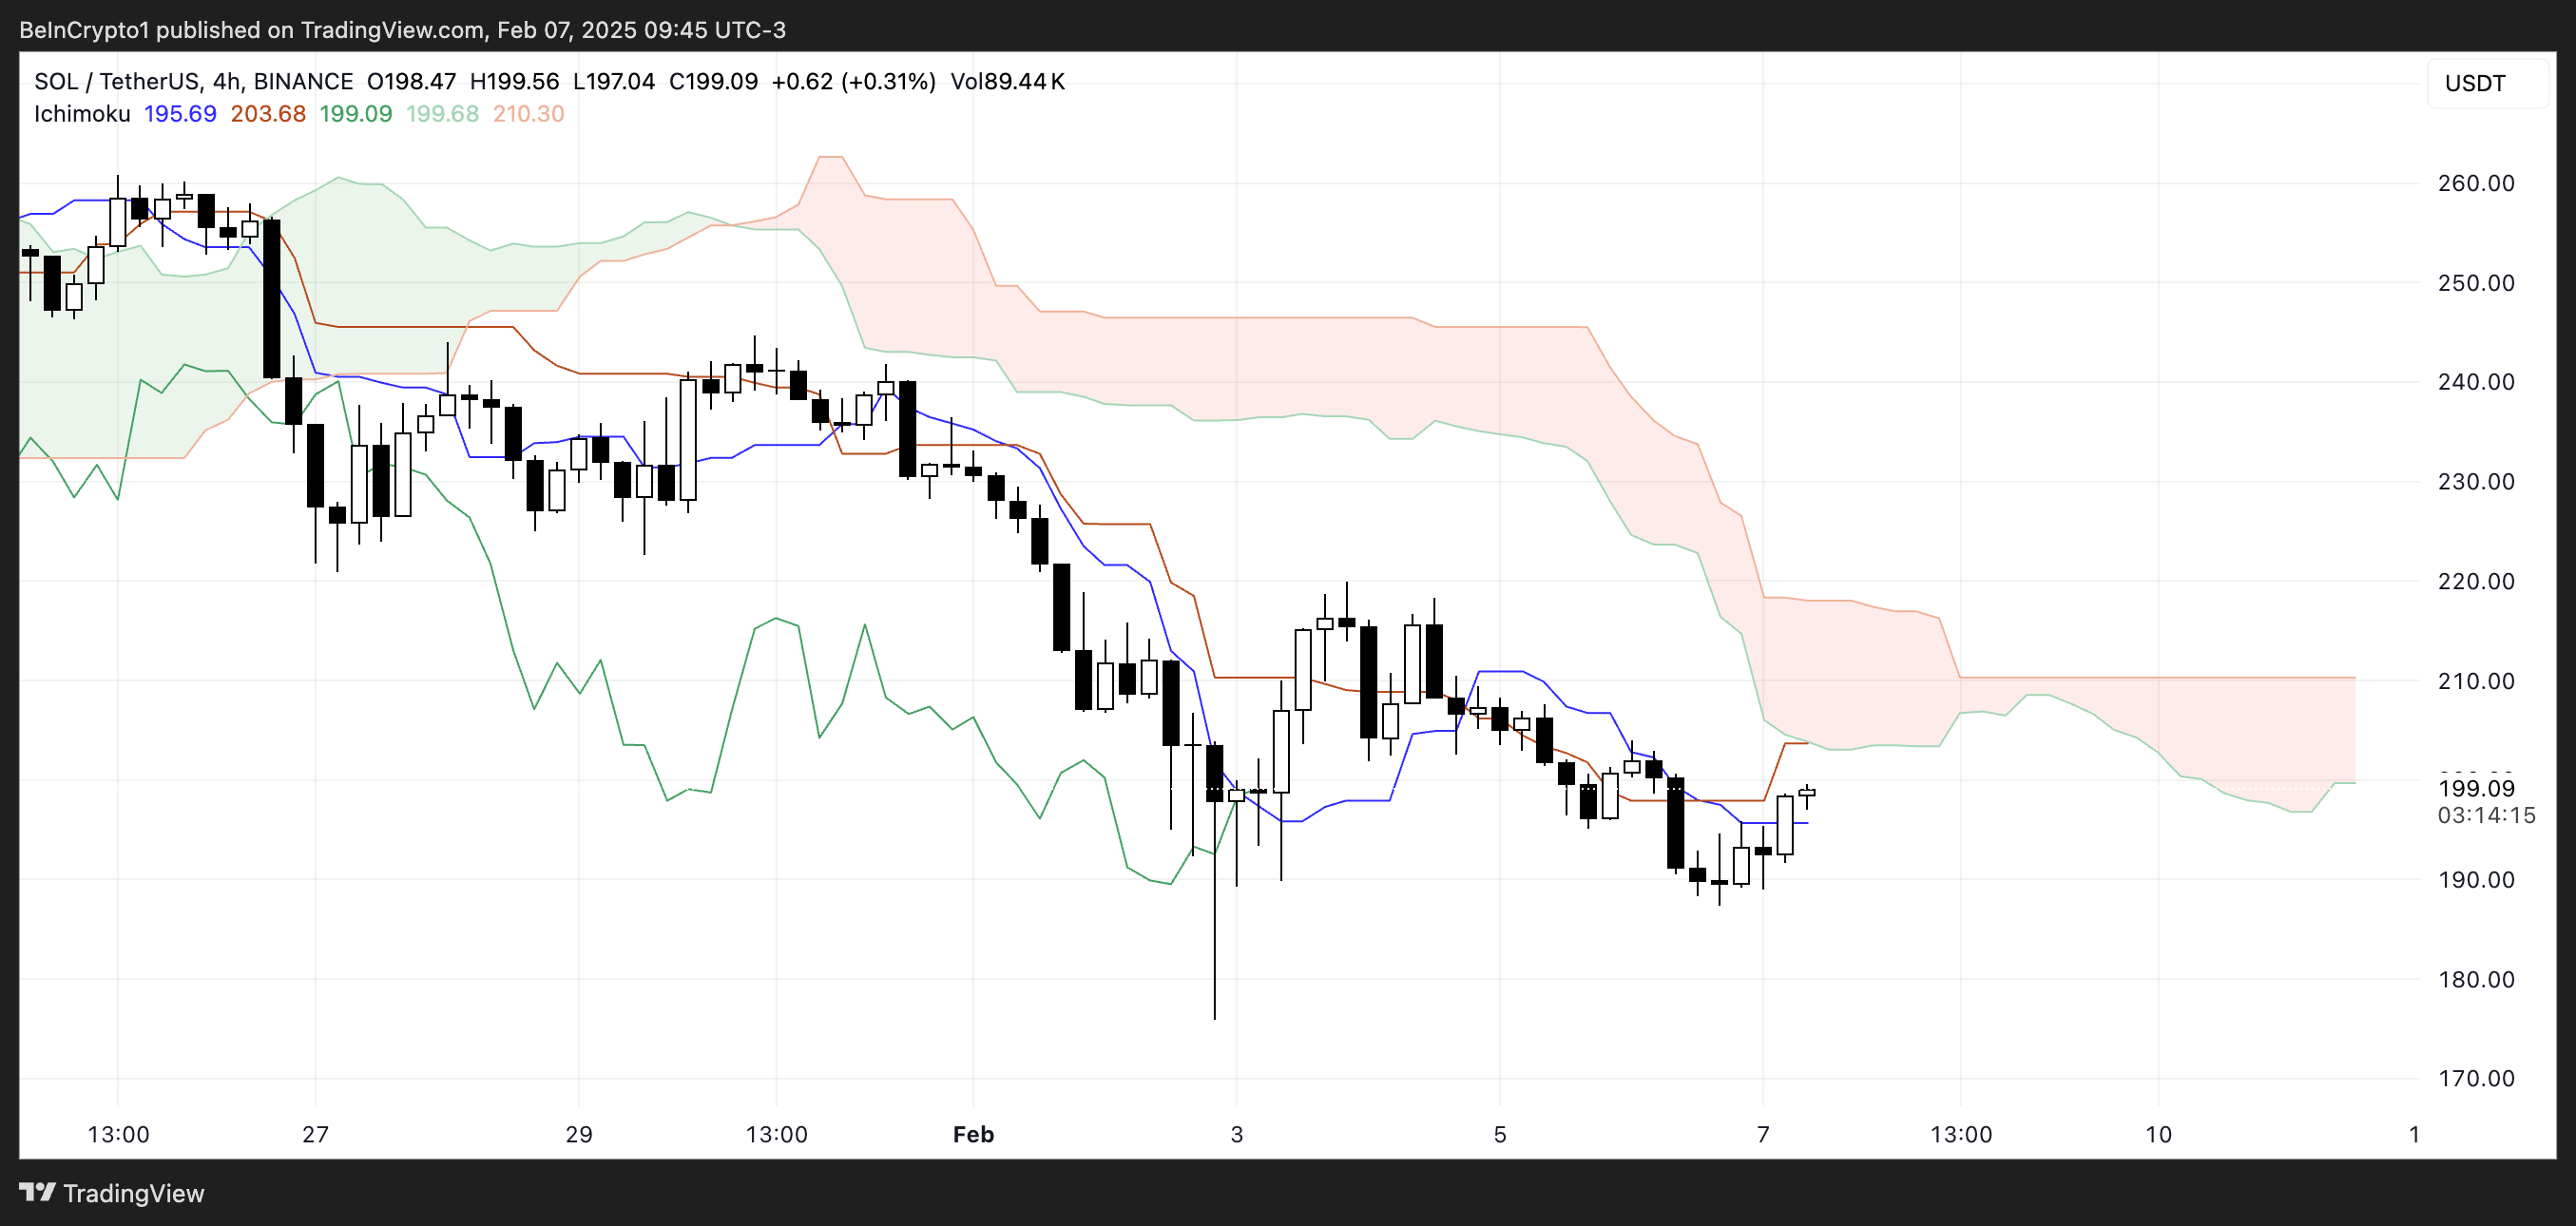
However, there are signs of potential stabilization, as SOL has recently attempted to push higher and is testing the Tenkan-sen. If the price can sustain momentum above this level, it may indicate an early shift in sentiment.
The Lagging Span (green line) is still below the price action, meaning that no clear bullish confirmation is present yet.
To establish a trend reversal, SOL would need to break above the cloud, which remains a key resistance zone. Until then, the prevailing Ichimoku structure suggests that the market is still in a corrective phase, with the cloud acting as a dynamic barrier to further upside movement.
Get to know Godleak
Godleak crypto signal is a service which provide profitable crypto and forex signals for trading. Godleak tried to provide you signals of best crypto vip channels in the world.
It means that you don’t need to buy individual crypto signal vip channels that have expensive prices. We bought all for you and provide you the signals with bot on telegram without even a second of delay.

Godleak crypto leak service have multiple advantages in comparision with other services:
- Providing signal of +160 best crypto vip channels in the world
- Using high tech bot to forward signals
- Without even a second of delay
- Joining in +160 separated channels on telegram
- 1 month, 3 months , 6 months and yearly plans
- Also we have trial to test our services before you pay for anything
For joining Godleak and get more information about us only need to follow godleak bot on telegram and can have access to our free vip channels. click on link bellow and press start button to see all features
Join for Free
☟☟☟☟☟
https://t.me/Godleakbot
Also you can check the list of available vip signal channels in the bot. by pressing Channels button.
 
Solana DMI Shows the Downtrend Could Be Easing
Solana Directional Movement Index (DMI) chart indicates that the Average Directional Index (ADX) is currently at 33.3 and has remained between 30 and 35 for the past four days. The ADX measures trend strength, with values above 25 generally indicating a strong trend and values below 20 suggesting weak or range-bound price action.
A reading between 30 and 35, as seen in SOL’s case, confirms that the ongoing trend – whether bullish or bearish – is holding firm.
However, the direction of the trend is determined by the movement of the +DI and -DI lines, which represent buying and selling pressure, respectively.
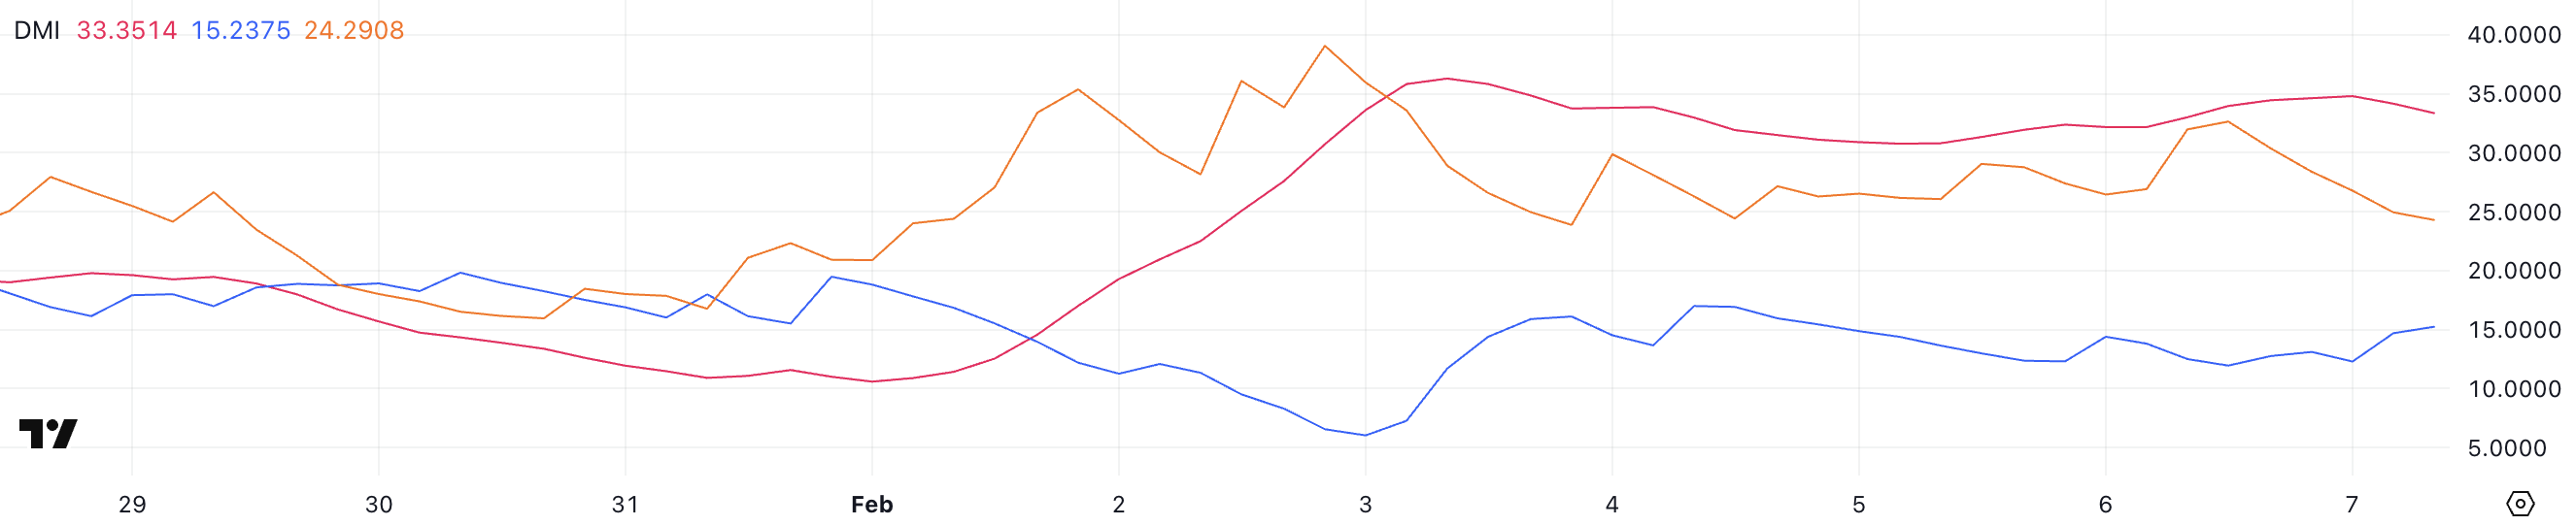
Currently, Solana +DI stands at 15.2 and has been stable around this level for the last three days, suggesting weak bullish momentum.
Meanwhile, -DI has dropped to 24.2 after being as high as 32.6 just a day ago, indicating that selling pressure is easing. While SOL remains in a downtrend, the declining -DI suggests that bearish momentum may be weakening.
If the +DI starts rising while -DI continues to drop, it could signal a potential trend reversal. However, as long as the ADX stays elevated and the -DI remains above the +DI, the downtrend remains dominant. SOL could still face further downside pressure before any meaningful recovery occurs.
SOL Price Prediction: Will Solana Break Above $220 Soon?
In recent days, Solana price has been hovering near the $200 level, consolidating within a tight range as market participants assess its next move.
If bullish momentum returns, SOL could test the $211 resistance level in the near term. A successful breakout above this zone could open the door for further gains, with $223 as the next key target.
Should buying pressure strengthen, SOL price could even rally toward $244, marking a potential 22% upside from current levels. However, for this scenario to play out, Solana needs sustained demand and a shift in momentum to overcome the recent bearish trend.
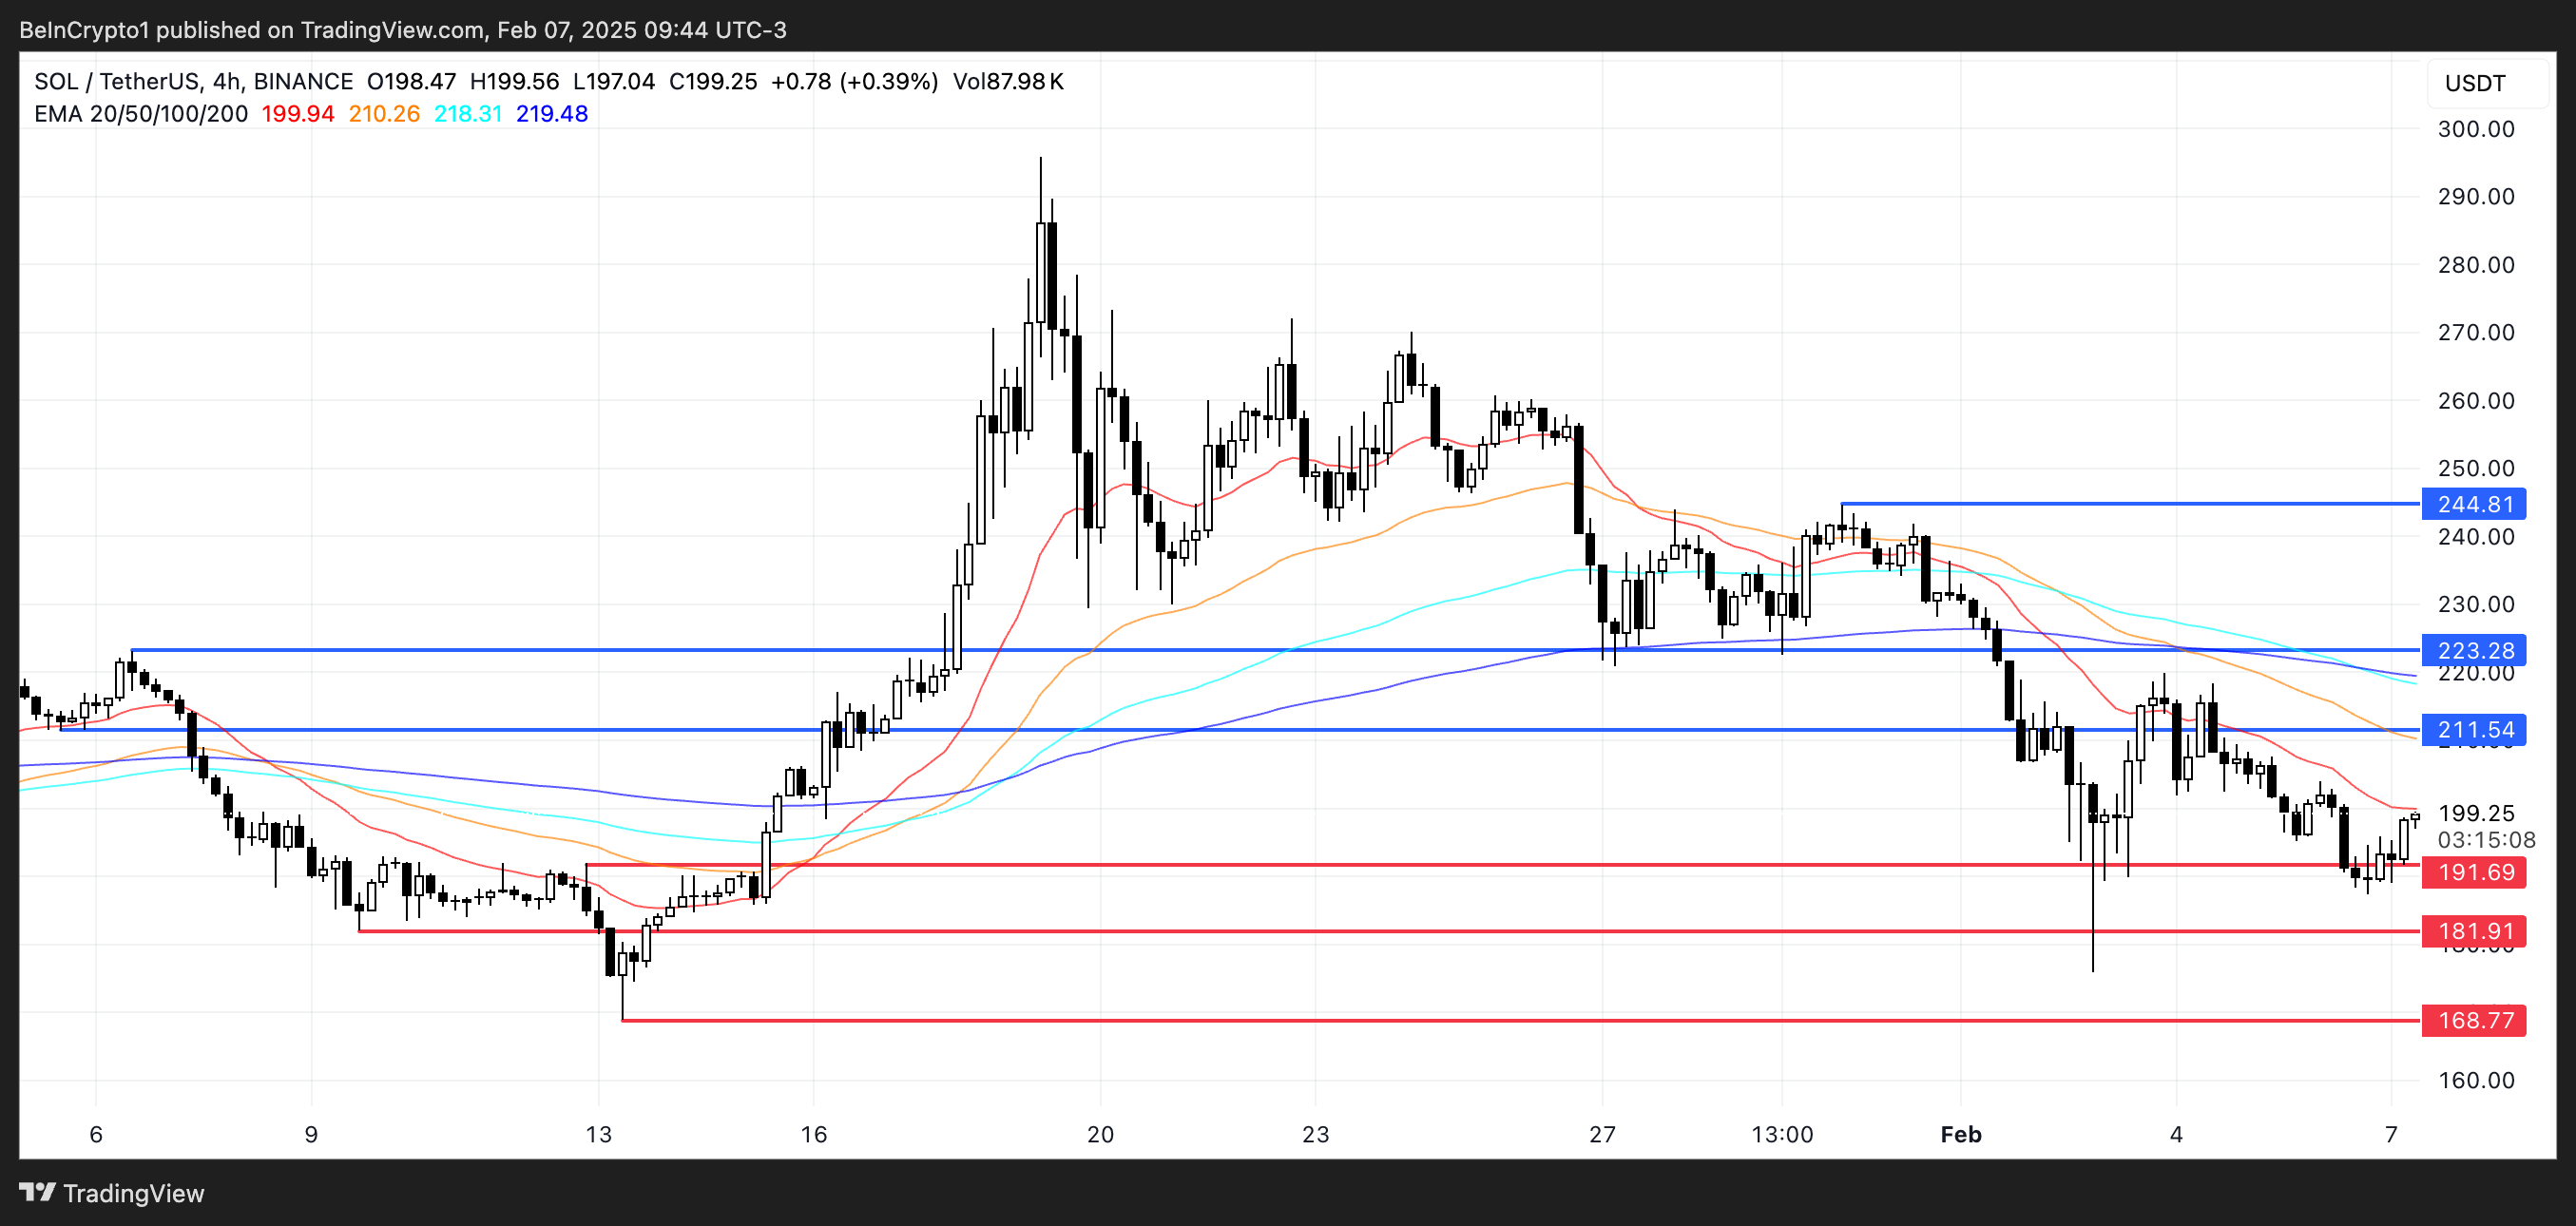
On the downside, if the current downtrend persists and selling pressure intensifies, SOL could soon retest the $191 support level.
A breakdown below this critical level may accelerate losses, potentially sending the price toward $181 or even as low as $168, representing a 15% further correction.


