
Stellar (XLM) Price Gains 12% With Trading Volume Reaching $1.75 Billion

In Brief
- XLM surges 12%, with trading volume up 163% to $1.64B, as bullish technical indicators highlight strong upward momentum.
- RSI at 65.7 reflects buying pressure nearing overbought levels, while the Ichimoku Cloud signals a robust bullish setup.
- Breaking $0.485 resistance could push XLM above $0.5; failure to hold $0.43 support may trigger a correction to $0.38.
Stellar (XLM) price has surged 12% in the last 24 hours, with its trading volume climbing 163% to $1.64 billion. Technical indicators like the RSI and Ichimoku Cloud show strong bullish momentum, signaling a potential continuation of the current uptrend.
With its EMA lines also reflecting a positive setup, XLM is approaching key resistance levels near $0.485. If broken, this could push the price above $0.5 for the first time since December 7. However, if bearish pressure emerges, critical support at $0.43 will need to hold to avoid a potential correction toward $0.38.
XLM RSI Confirms a Strong Buying Pressure
Stellar RSI is at 65.7, retreating slightly from 71.9 earlier today but rising sharply from 37.3 two days ago. This indicates strong buying momentum, with the RSI now in bullish territory, though close to overbought levels.
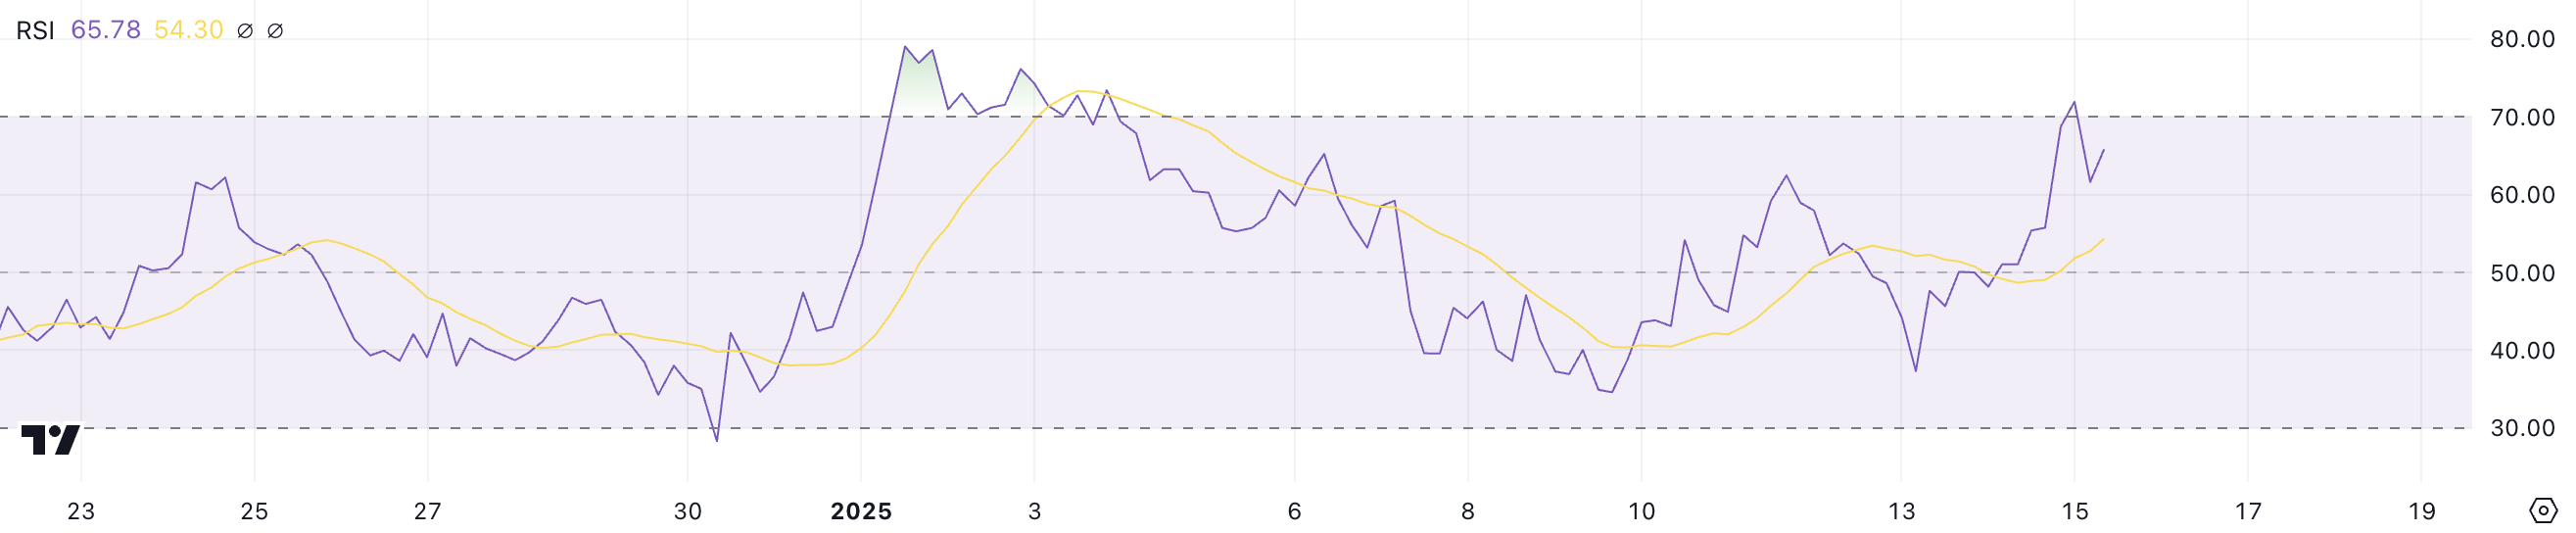
The RSI measures price momentum on a scale of 0 to 100, with values below 30 signaling oversold conditions and above 70 indicating overbought levels.
At 65.7, XLM RSI suggests continued bullish momentum, but caution is warranted as further gains could push it into overbought territory, increasing the likelihood of a correction.
Ichimoku Cloud Shows Stellar Is Building a Bullish Setup
Stellar Ichimoku Cloud chart shows a bullish breakout. XLM price is now trading well above the green Kumo (cloud).
The Senkou Span A (green line) is above Senkou Span B (red line), signaling a bullish cloud setup that supports the upward momentum. The cloud’s thickness indicates moderate support, providing a stable base for the current trend.
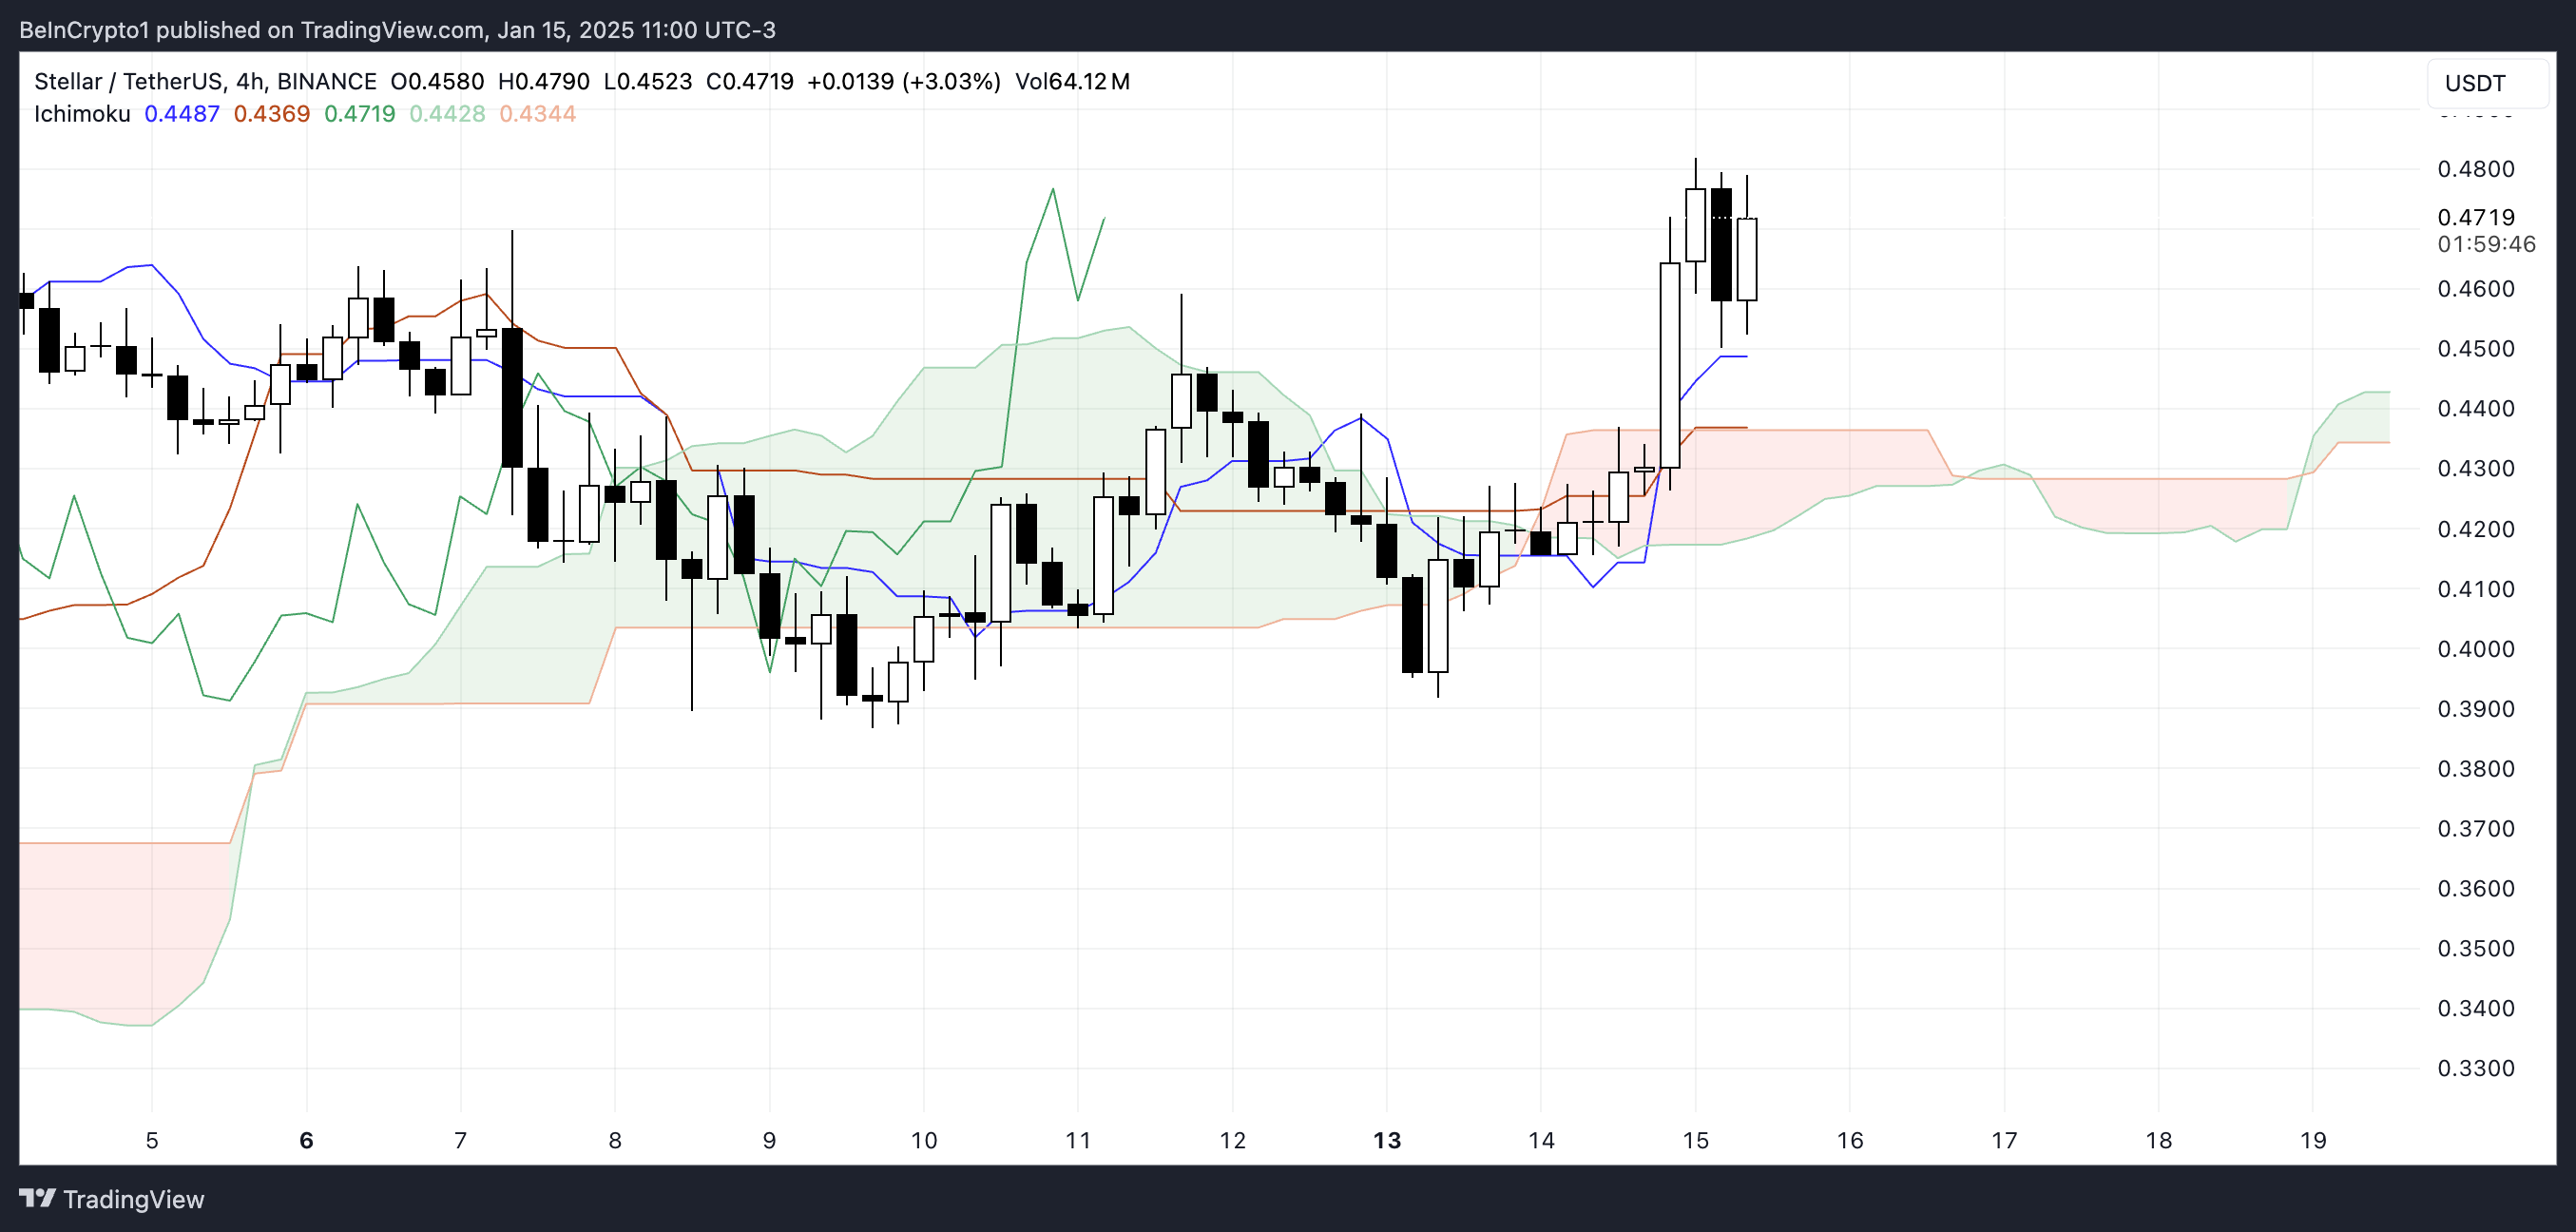
The blue Kijun-Sen (baseline) is below the price, while the orange Tenkan-Sen (conversion line) is trending upward and closely aligned with the price, reflecting strong short-term momentum. Additionally, the lagging span (green line) is positioned above both the price and the cloud, confirming the bullish sentiment.
These signals collectively suggest that XLM price has established a strong uptrend, and the Ichimoku setup supports continued price strength in the near term.
Get to know Godleak
Godleak crypto signal is a service which provide profitable crypto and forex signals for trading. Godleak tried to provide you signals of best crypto vip channels in the world.
It means that you don’t need to buy individual crypto signal vip channels that have expensive prices. We bought all for you and provide you the signals with bot on telegram without even a second of delay.

Godleak crypto leak service have multiple advantages in comparision with other services:
- Providing signal of +160 best crypto vip channels in the world
- Using high tech bot to forward signals
- Without even a second of delay
- Joining in +160 separated channels on telegram
- 1 month, 3 months , 6 months and yearly plans
- Also we have trial to test our services before you pay for anything
For joining Godleak and get more information about us only need to follow godleak bot on telegram and can have access to our free vip channels. click on link bellow and press start button to see all features
Join for Free
☟☟☟☟☟
https://t.me/Godleakbot
Also you can check the list of available vip signal channels in the bot. by pressing Channels button.
 
XLM Price Prediction: Can Stellar Rise to $0.50 Again?
Stellar EMA lines display a bullish setup, with short-term lines positioned above the long-term ones and the gap between them widening. This configuration signals strong upward momentum and growing confidence in the current uptrend.
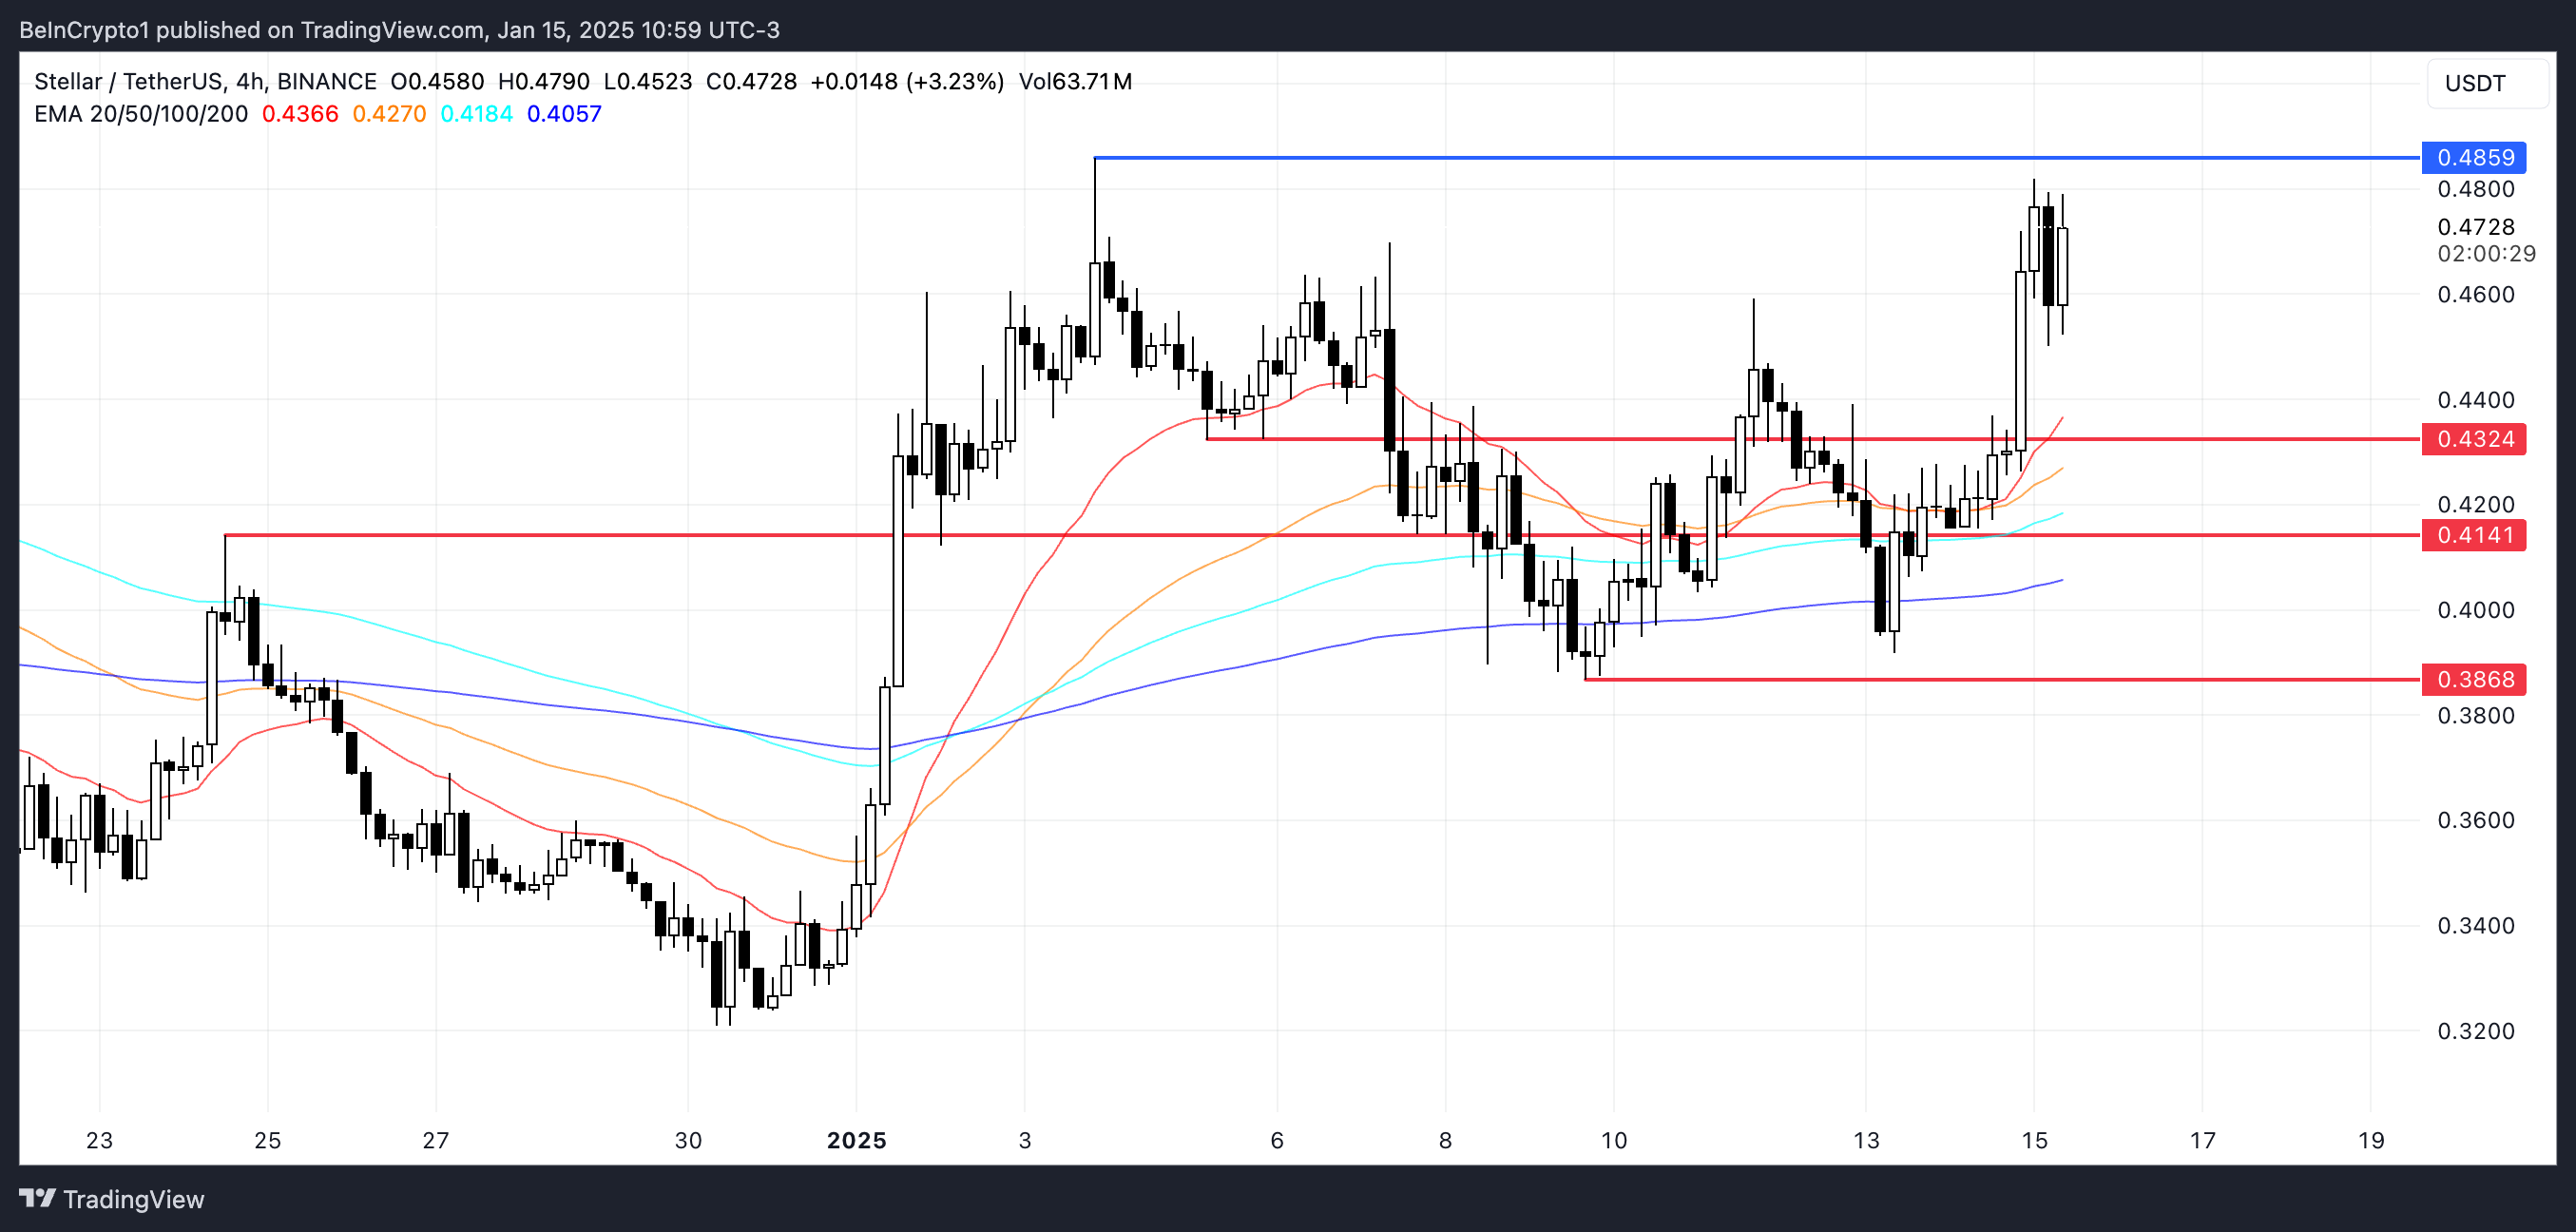
If the resistance at $0.485 is tested and broken, Stellar price could rise above $0.50, reaching those levels for the first time since December 7. Conversely, if bearish pressure builds, the support at $0.43 may come into play.
A break below this level could push XLM price further down to $0.41 or even $0.38, marking a potential 19% correction.


