
FTX Token (FTT) Price Rises as FTX Plans Creditor Payments on February 18

In Brief
- FTT price rises as FTX plans creditor payments, but trend strength remains weak despite bullish momentum.
- RSI climbs to 59.2, signaling growing buying pressure, while ADX stays low, indicating an unconfirmed uptrend.
- FTT eyes resistance at $2.44, with a golden cross potentially pushing the price toward $3 if momentum builds.
FTX Token (FTT) price is up following news that the exchange will begin payments to Bahamas creditors on February 18. Despite this positive development, FTT is still fighting to maintain levels above $2 as technical indicators show mixed signals.
While RSI has recovered from oversold conditions and bullish momentum is building, ADX remains weak, suggesting that trend strength is not yet fully established. If FTT can break key resistance levels, it could push toward $3. However, a failure to hold current support may lead to a deeper pullback.
FTT Downtrend Is Losing Its Steam, But the Uptrend Is Still Consolidating
FTT DMI chart shows that its ADX has dropped to 23.4, down from 41 just four days ago. This decline suggests that the strength of the previous downtrend is weakening.
ADX measures trend intensity but does not indicate direction. That means that while FTT is attempting to form an uptrend, the lower ADX suggests the momentum behind this move is not yet strong.
If ADX falls further below 20, it could indicate consolidation, while a rebound above 25 would signal a strengthening trend.
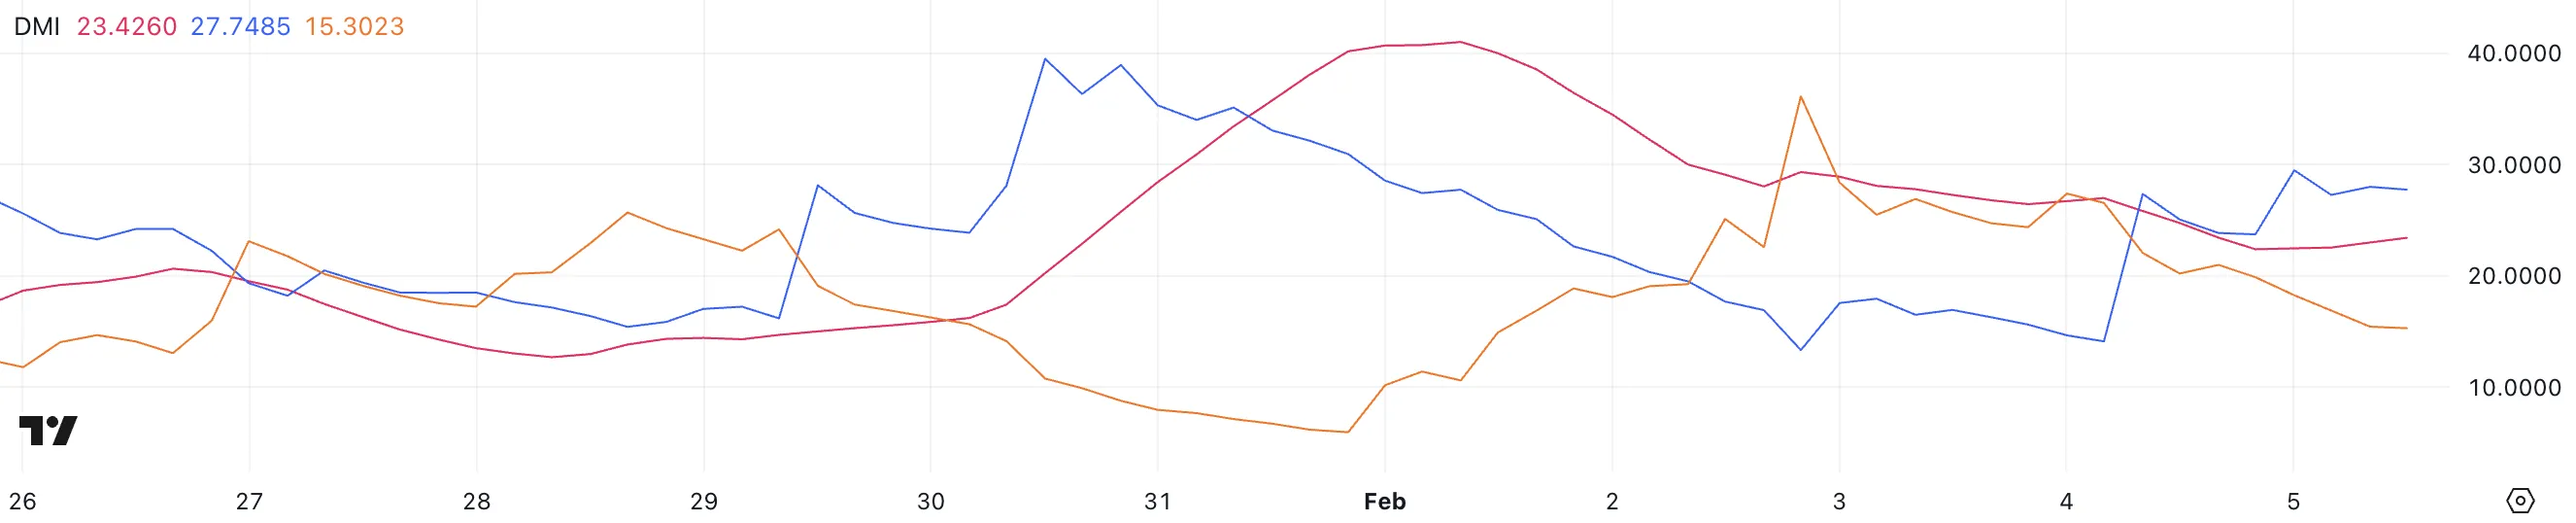
ADX is a key part of the Directional Movement Index (DMI) that tracks trend strength. Values above 25 indicate a strong trend, and readings below 20 suggest weak or indecisive price action.
Meanwhile, FTX Token +DI has surged to 27.7 from 14.1 in just one day, signaling increasing bullish pressure, while -DI has dropped from 26.5 to 15.3, showing that bearish momentum is fading.
This crossover, where +DI moves above -DI, supports the case for an uptrend. If ADX starts rising again, FTT could see a stronger bullish continuation, but if ADX remains weak, the price may struggle to gain momentum.
Get to know Godleak
Godleak crypto signal is a service which provide profitable crypto and forex signals for trading. Godleak tried to provide you signals of best crypto vip channels in the world.
It means that you don’t need to buy individual crypto signal vip channels that have expensive prices. We bought all for you and provide you the signals with bot on telegram without even a second of delay.

Godleak crypto leak service have multiple advantages in comparision with other services:
- Providing signal of +160 best crypto vip channels in the world
- Using high tech bot to forward signals
- Without even a second of delay
- Joining in +160 separated channels on telegram
- 1 month, 3 months , 6 months and yearly plans
- Also we have trial to test our services before you pay for anything
For joining Godleak and get more information about us only need to follow godleak bot on telegram and can have access to our free vip channels. click on link bellow and press start button to see all features
Join for Free
☟☟☟☟☟
https://t.me/Godleakbot
Also you can check the list of available vip signal channels in the bot. by pressing Channels button.
 
FTT RSI Is Rising Fast
FTT’s Relative Strength Index (RSI) is currently at 59.2, up significantly from 22 just three days ago, after the announcement that FTX will start paying Bahamas creditors from February 18.
This sharp increase suggests that buying pressure has returned after FTT was in oversold conditions. An RSI below 30 typically signals that an asset is oversold and due for a rebound, which aligns with FTT’s recent price recovery.
Now approaching the 60 level, momentum is turning more bullish, though FTX Token still needs to push higher to confirm a strong upward continuation.
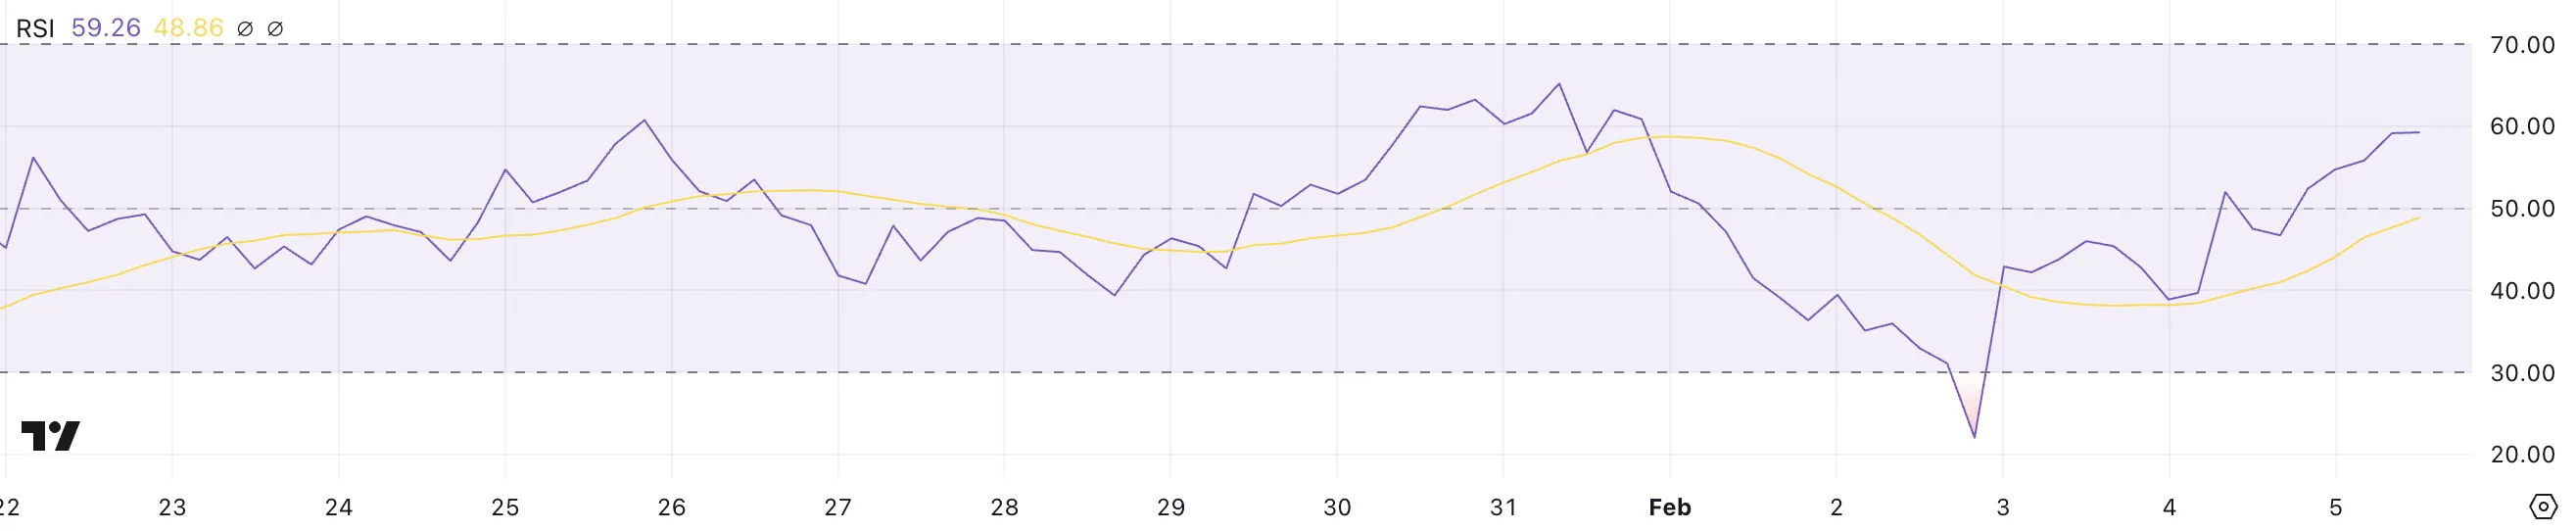
RSI is a momentum indicator that measures the strength and speed of price movements on a scale from 0 to 100. Readings above 70 suggest an asset is overbought and may be due for a pullback, while readings below 30 indicate oversold conditions and a potential price recovery.
With FTT’s RSI now at 59.2, it is nearing overbought territory but still has room to climb. If RSI crosses above 60, it could indicate further bullish momentum. However, if it starts declining, FTT may consolidate before making its next move.
FTT Price Prediction: Can FTT Rise to $3 In February?
FTX Token’s EMA lines show that its short-term moving averages are still below the long-term ones but are gradually moving upward. If they cross above the long-term EMAs, it will form a golden cross. This is a bullish signal that could push FTT toward the next resistance levels at $2.32 to $2.44.
A successful breakout above these levels could open the door for a further move to $2.77. Additionally, speculation around Donald Trump potentially pardoning FTX co-founder Sam Bankman-Fried could trigger a surge in FTT’s price, pushing it toward $3 or even $4.
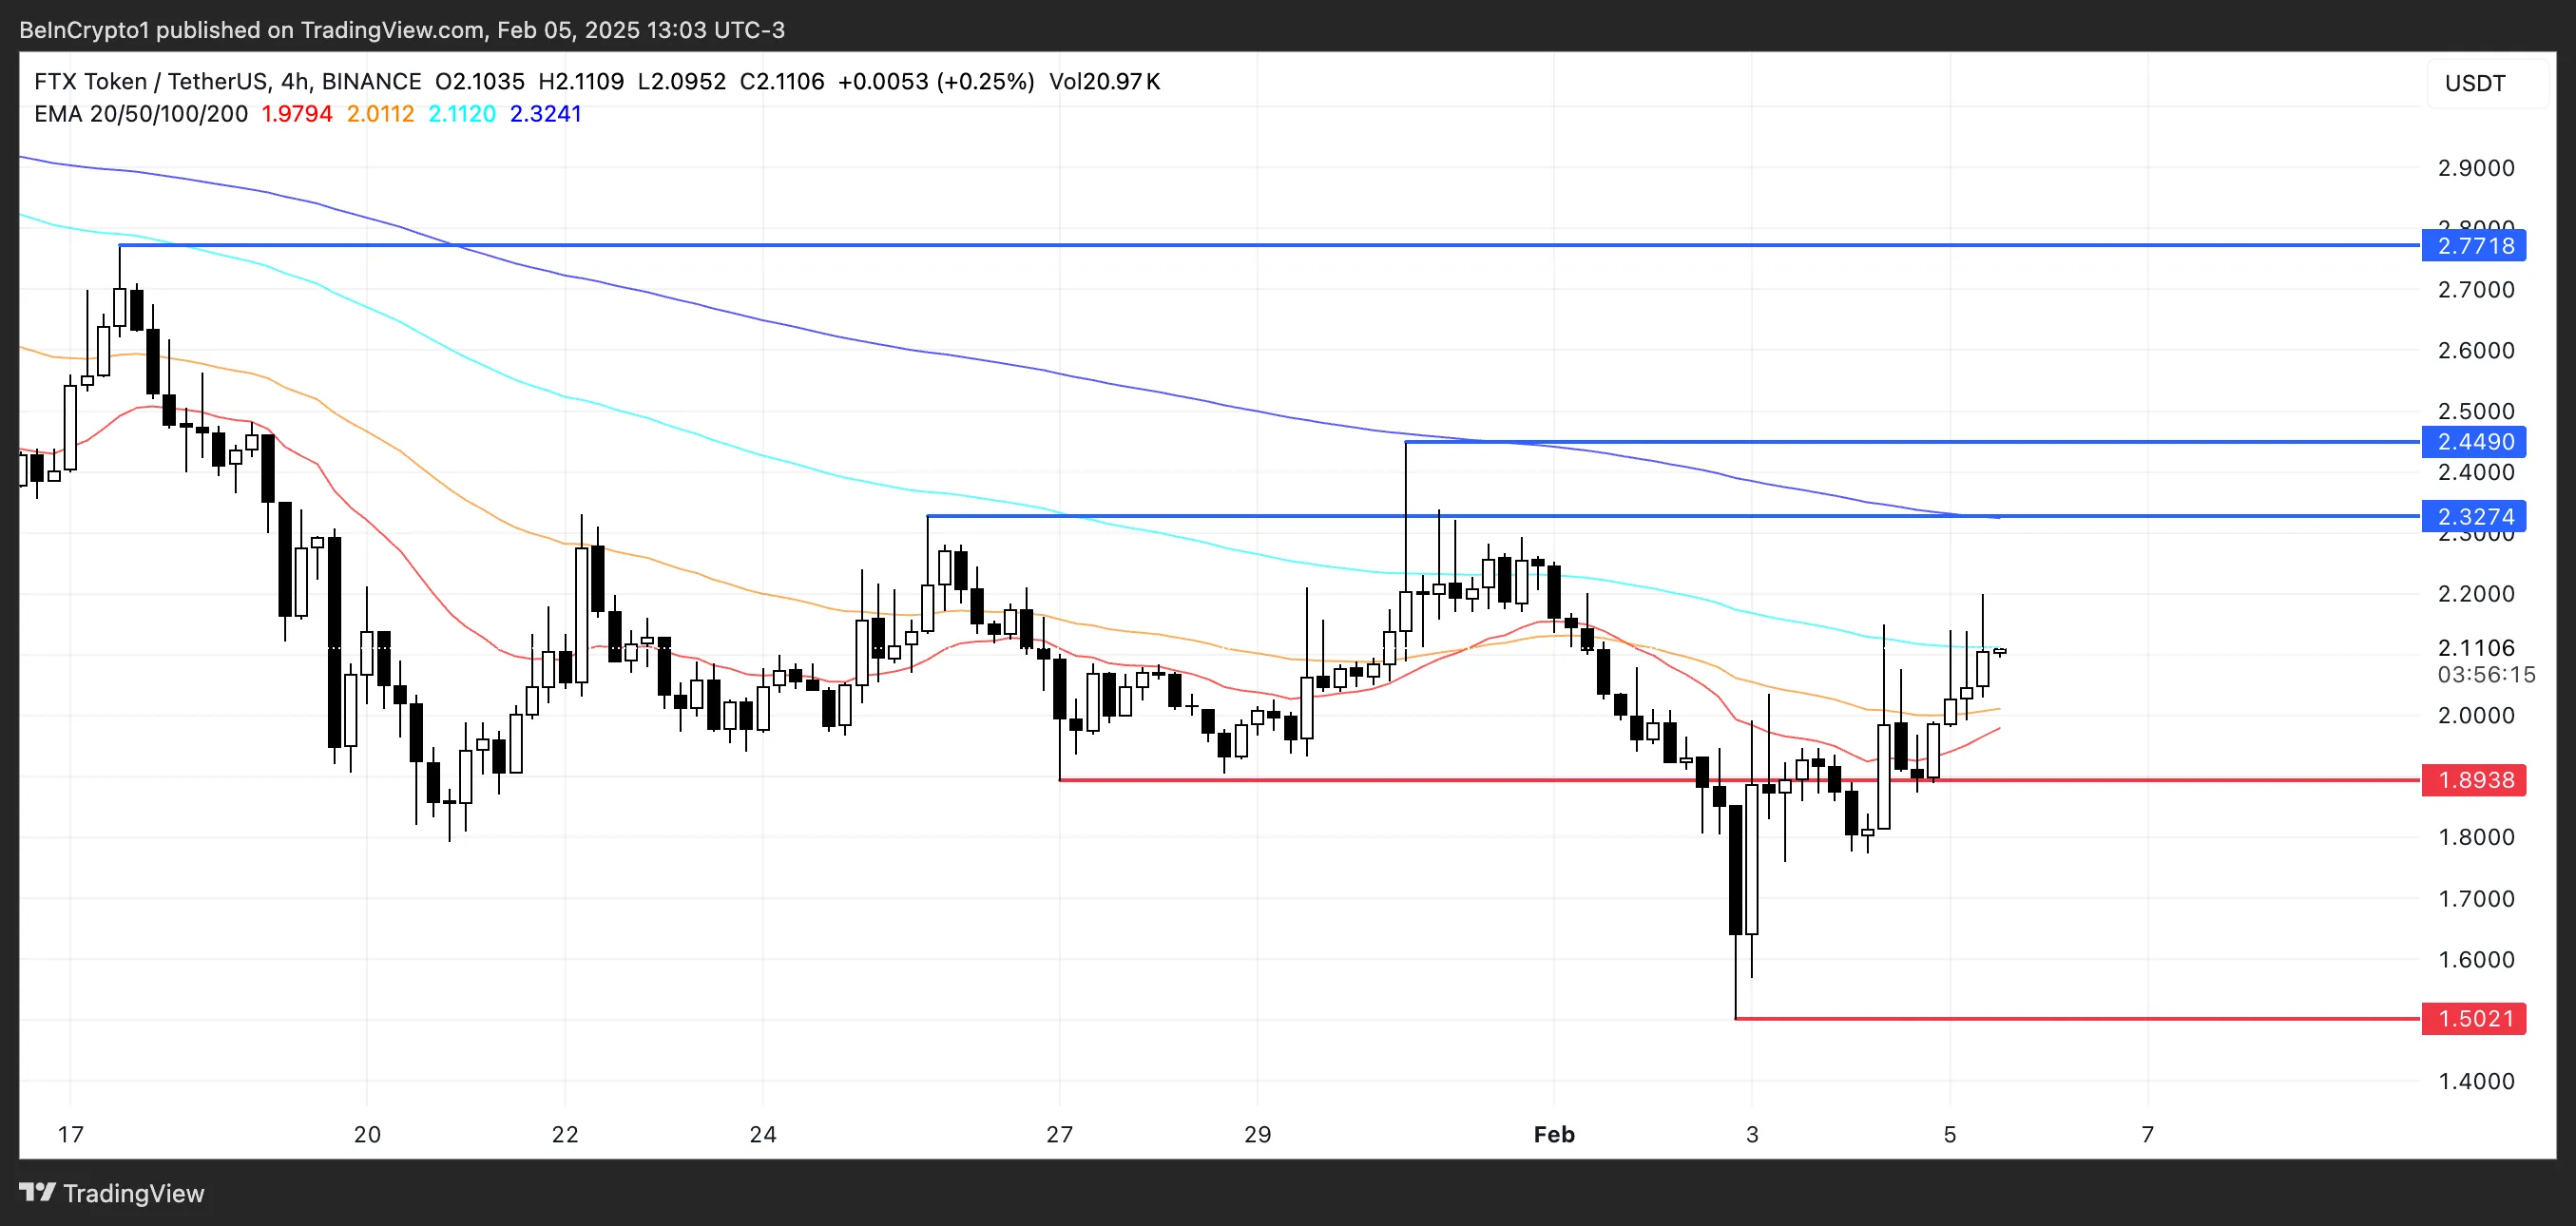
On the other hand, if FTT price fails to establish an uptrend, it may struggle to hold its current levels. A drop toward the $1.89 support could indicate weakening momentum. If that level is lost, the token could fall as low as $1.50.
With EMA lines still in a bearish setup, the market remains at a critical point where either a confirmed breakout or a deeper pullback could unfold.


