
TRUMP Price Surges 10% as Market Cap Nears $4 Billion Again
In Brief
- TRUMP price jumps 10% in 24 hours but remains below key resistance levels amid bearish pressure.
- RSI recovers from oversold levels, but BBTrend stays negative, signaling lingering downside risks.
- TRUMP eyes $24.58 resistance as momentum builds, but failure to break higher could trigger a correction.
TRUMP price is up roughly 10% in the last 24 hours, bringing its market cap back close to $4 billion. Despite this rebound, TRUMP has lost its third-place ranking among the largest meme coins to PEPE.
While RSI has recovered from oversold levels and price action is improving, BBTrend remains in deeply negative territory, signaling lingering bearish pressure. The meme coin now faces a critical test—if the current uptrend continues, it could reclaim key resistance levels, but rebound selling pressure could influence a move back toward lower supports.
TRUMP RSI Is Recovering From Oversold Levels, But It’s Still Neutral
TRUMP Relative Strength Index (RSI) is currently at 48.5, rising from 27.8 just two days ago after hitting a low of 19.8 four days ago. This sharp recovery indicates that buying pressure has returned after TRUMP was in deeply oversold conditions.
An RSI below 30 suggests that an asset is oversold and could be due for a rebound, which aligns with the recent price action. Now at 48.5, TRUMP’s RSI is at its highest level in weeks, showing that momentum is shifting toward a more neutral stance, though it has not yet entered bullish territory.
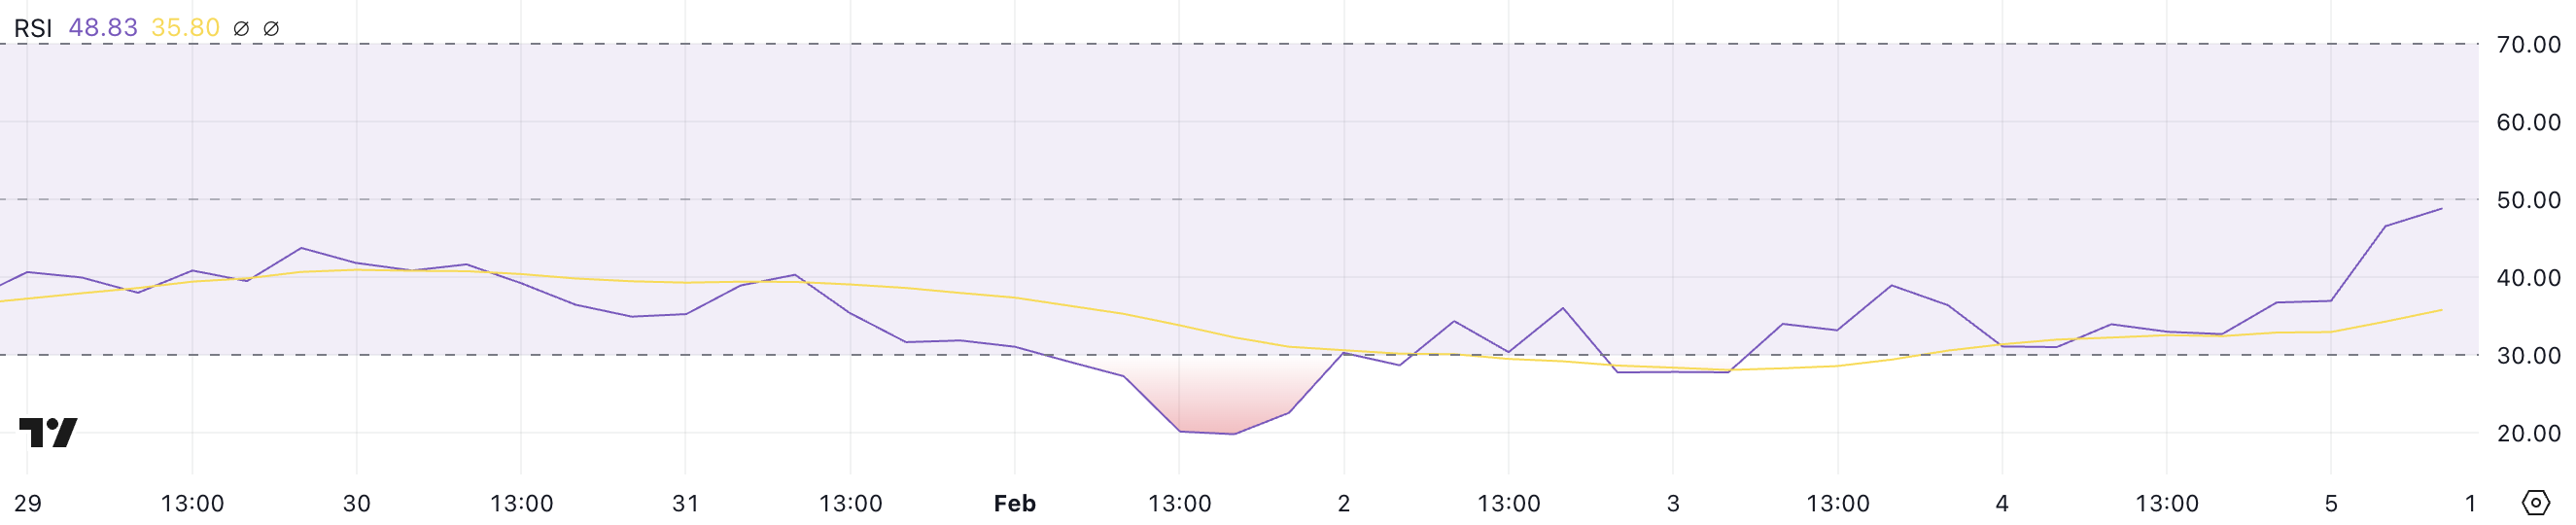
RSI is a momentum indicator that measures the speed and magnitude of price movements on a scale from 0 to 100. Readings above 70 suggest overbought conditions and a potential pullback, while readings below 30 indicate oversold conditions and a possible recovery.
With TRUMP RSI now at 48.5, it is nearing the 50 level, which often signals a balance between buying and selling pressure. If RSI continues rising and crosses 50, it could indicate growing bullish momentum.
However, if the RSI struggles to break higher, TRUMP may remain in a consolidation phase before making its next move.
Get to know Godleak
Godleak crypto signal is a service which provide profitable crypto and forex signals for trading. Godleak tried to provide you signals of best crypto vip channels in the world.
It means that you don’t need to buy individual crypto signal vip channels that have expensive prices. We bought all for you and provide you the signals with bot on telegram without even a second of delay.

Godleak crypto leak service have multiple advantages in comparision with other services:
- Providing signal of +160 best crypto vip channels in the world
- Using high tech bot to forward signals
- Without even a second of delay
- Joining in +160 separated channels on telegram
- 1 month, 3 months , 6 months and yearly plans
- Also we have trial to test our services before you pay for anything
For joining Godleak and get more information about us only need to follow godleak bot on telegram and can have access to our free vip channels. click on link bellow and press start button to see all features
Join for Free
☟☟☟☟☟
https://t.me/Godleakbot
Also you can check the list of available vip signal channels in the bot. by pressing Channels button.
 
TRUMP BBTrend Is Still Very Low
TRUMP BBTrend is currently at -45.07, marking its ninth consecutive day in negative territory. While it briefly turned positive on February 1, reaching 0.16, it quickly reversed and continued its downward trend.
Yesterday, the BBTrend was at -49.29, meaning there has been a slight improvement, but it remains deeply negative. This prolonged period of weakness suggests that TRUMP is still in a bearish phase, struggling to regain strong momentum.
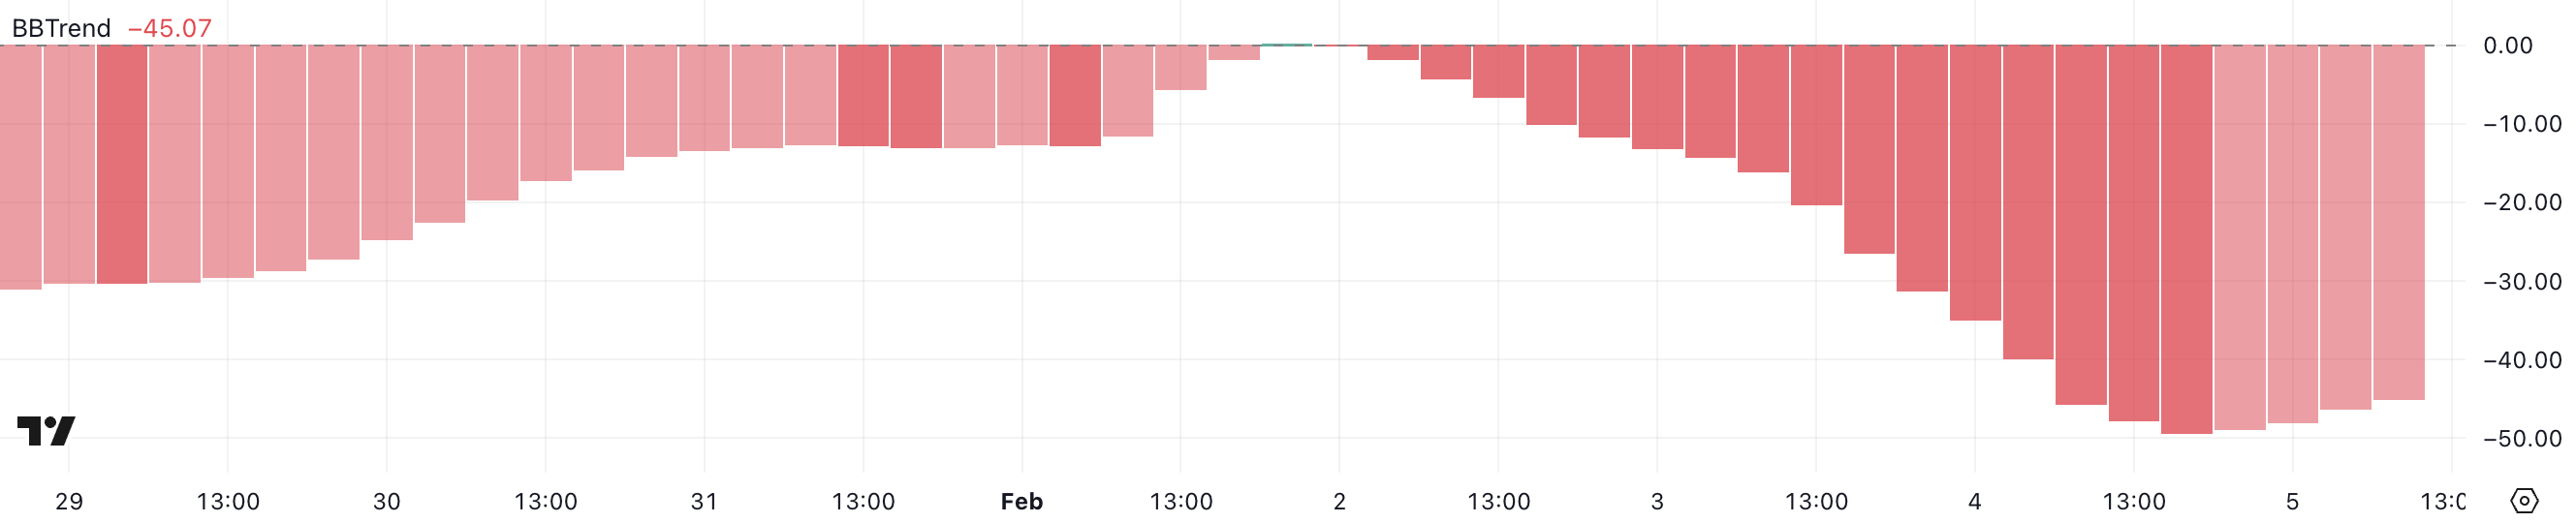
BBTrend (Bollinger Band Trend) measures the strength and direction of a trend based on Bollinger Bands. A positive BBTrend indicates bullish momentum, while a negative reading signals bearish conditions.
With TRUMP’s BBTrend now at -45.07 but slightly improving from -49.29, the bearish pressure is still dominant, though selling momentum may be slowing.
If the BBTrend continues rising toward zero, it could suggest that TRUMP is stabilizing. If it remains negative, the downtrend could persist.
TRUMP Price Prediction: Can the Meme Coin Reclaim $30 In February?
If the current uptrend holds, TRUMP price could continue its recovery and test the resistance at $24.58. A breakout above this level could push the price higher, with the next major target around $30.47.
That would possibly make TRUMP reclaim the third spot among the biggest meme coins, surpassing PEPE.
Given the recent improvement in RSI, bullish momentum is building, but TRUMP still needs to clear key resistance levels to confirm a sustained uptrend.
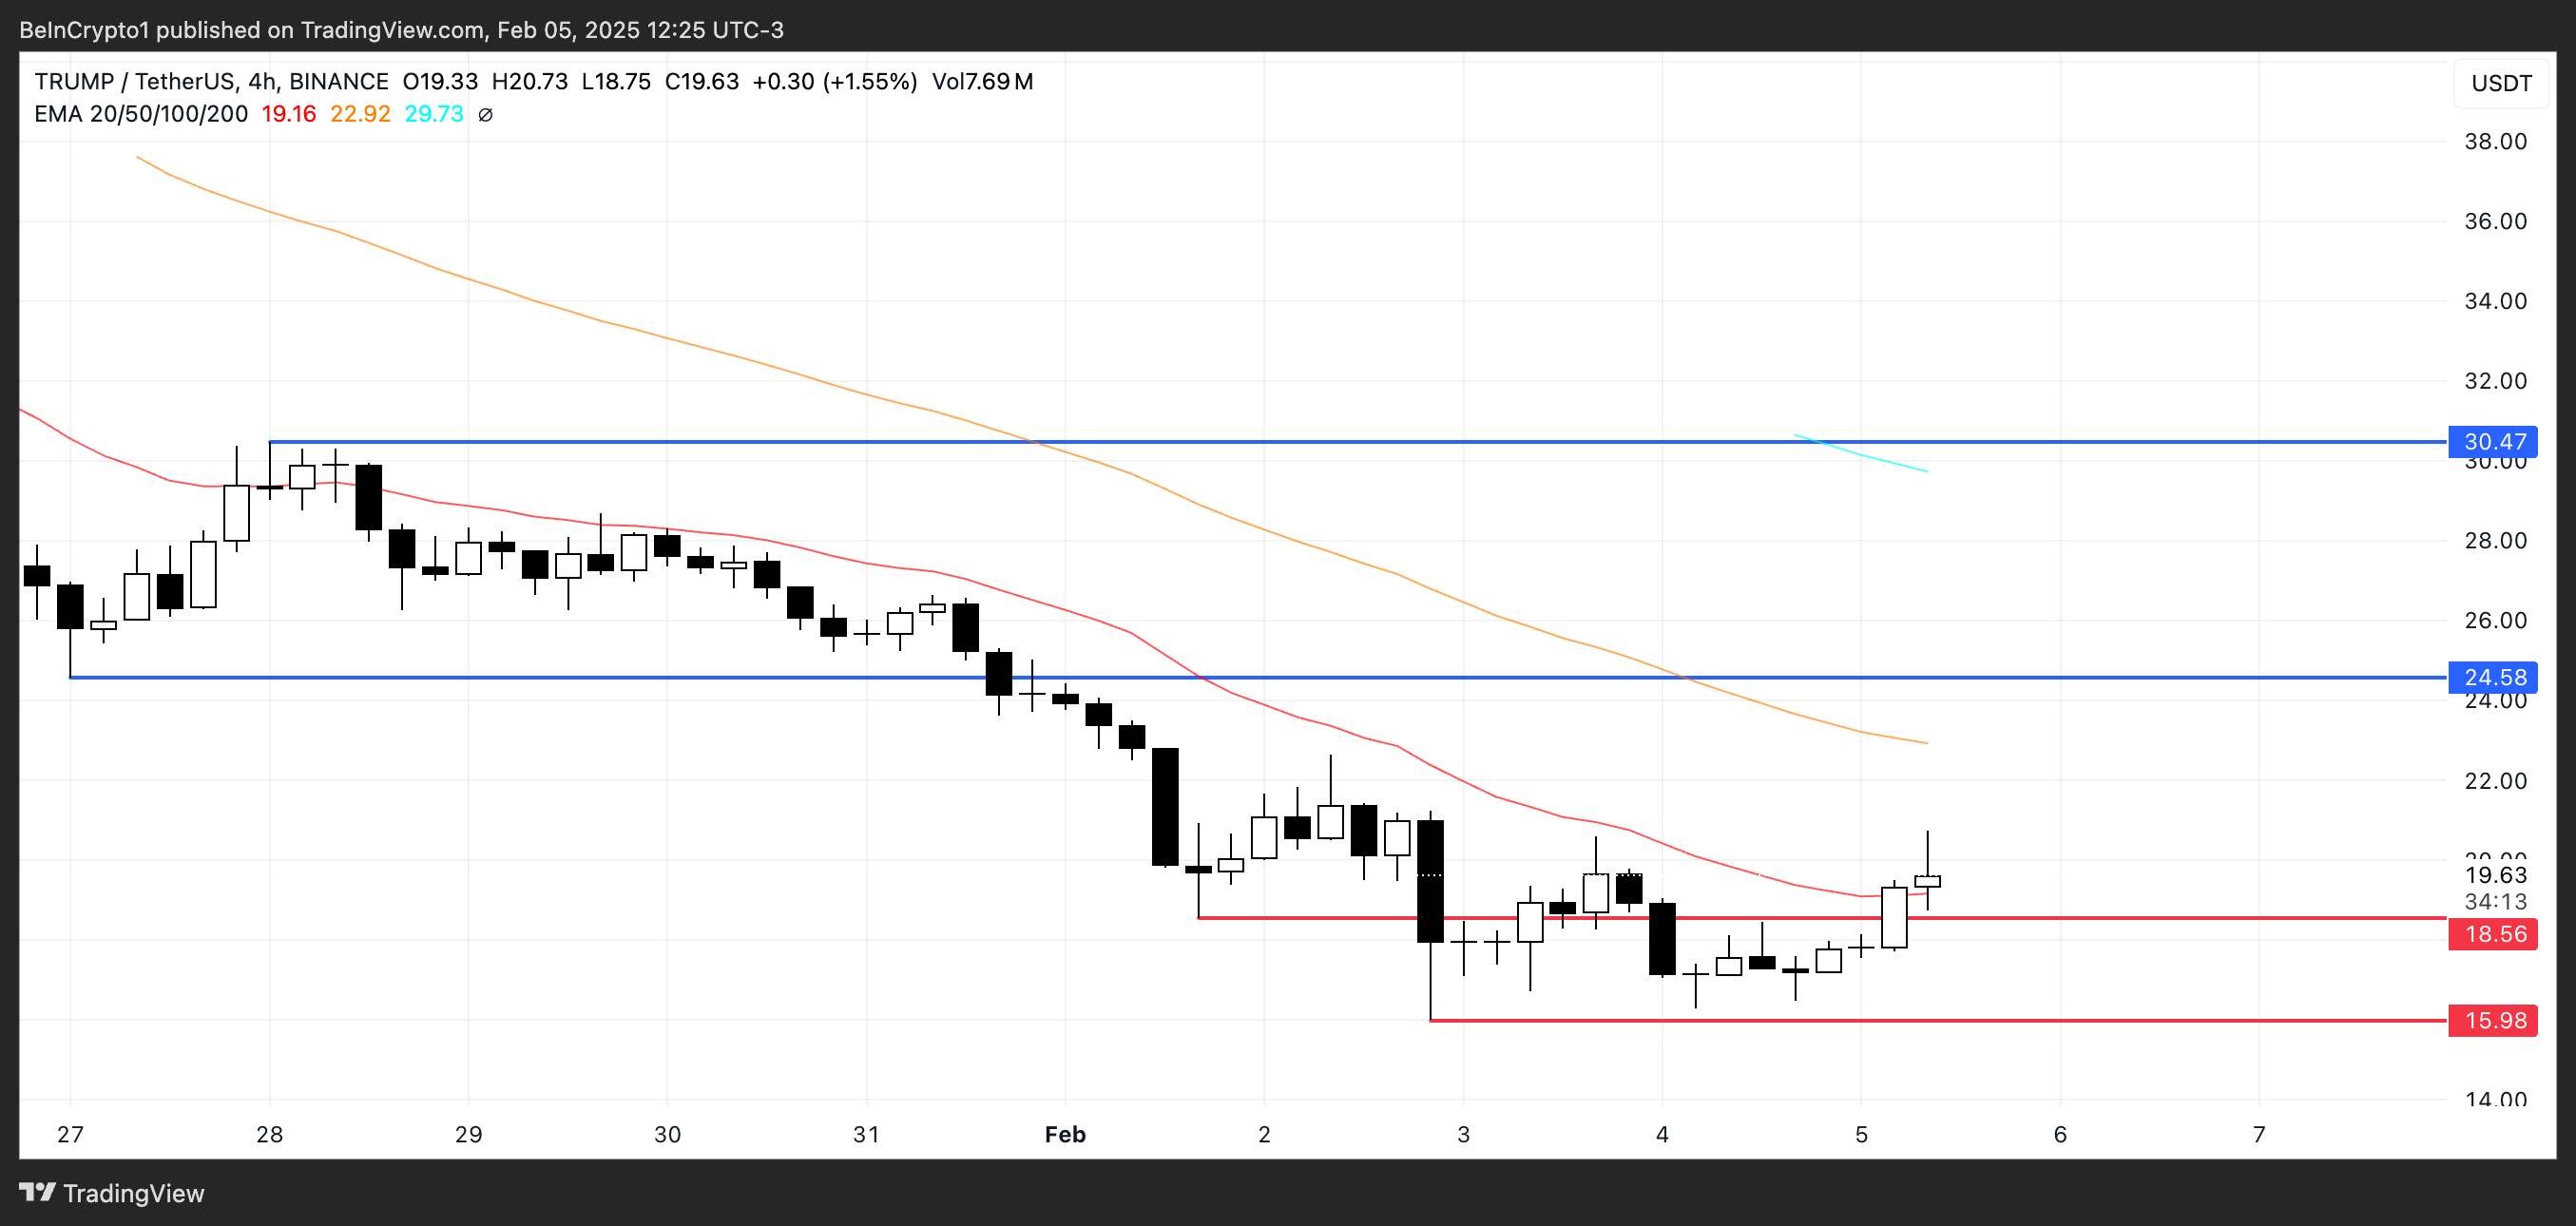
On the other hand, BBTrend remains negative, suggesting that recent gains could be short-lived. If bearish pressure returns, TRUMP price may test the support at $18.56, and if that level breaks, it could drop further to $15.98, marking new lows.
The market is at a critical point where a rejection at resistance could lead to a deeper correction. For the meme coin to maintain its uptrend, it needs to hold above key support levels and break through resistance with strong momentum.


